

Description
Are you interested in an updated edition? Then please indicate the desired publication date and content in the form. We look forward to responding to you promptly.
The PLA Market Report is now also available in parts (e.g. individual country profiles or all manufacturer profiles). Please feel free to contact us and we will immediately send you an offer for your specific selection.
Cutting-edge technology from the field: Polylactic acid, or PLA for short, is one of the most important raw materials for 3D printing but also for medical sewing thread and implants. Less spectacular but strongly growing areas of application for this bioplastic are viewing windows of bread bags and other packaging materials. The new Ceresana market study “Polylactic Acid (PLA)” forecasts that PLA sales will reach around USD 3.7 billion worldwide by 2032.
Biobased and Biodegradable Plastics
While polylactic acid can be obtained from whey or other dairy products, PLA is usually fermented from plant starch, such as corn, sugar beets or sugar cane. PLA can be compostable or long-lasting, depending on the manufacturing process, added additives and copolymers. Like other bioplastics, PLA is benefiting from the growing popularity of renewable raw materials and government regulations on single-use products and plastic bags. Plastics manufacturers are responding to growing consumer awareness of plastic waste issues with significant expansions of the production capacities for PLA in various countries, such as France, the USA and Thailand, but especially in China. By 2032, Ceresana expects more than two-thirds of global PLA production to take place in Asia.
Packaging: Main Application of PLA
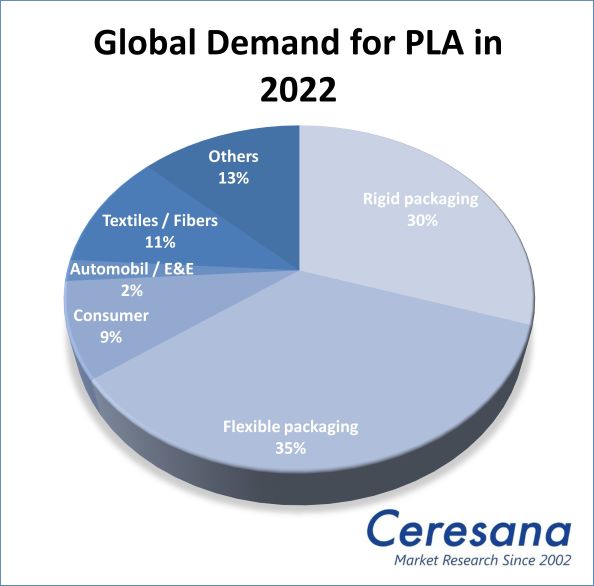
PLA has a wide range of applications, from simple fastening clips for agriculture to cosmetic fillers. Biocompatible implants that dissolve in the human body and skin-compatible hygiene products have been areas of application where PLA has been profitable for years. Nowadays, PLA is mainly used to produce packaging, such as biodegradable films, nets, rigid containers, coated paper or foamed packaging. PLA blends are also used, among other things, to produce air cushion bags and filling material for packaging (loose fill). The packaging industry is currently the most important market for PLA with a share of around 65%. Ceresana expects flexible packaging to grow at a rate of 15.2% per year. PLA fibers are also increasingly being used in the textile industry for yarns or upholstery. Globally, Ceresana expects the demand for PLA to quadruple over the next ten years.
The Current Market Report “Polylactic Acid (PLA)”:
Chapter 1 of the study provides a comprehensive depiction and analysis of the global market for PLA – including forecasts up to 2032: the development of demand for (tonnes), revenues generated with (USD and EUR) and production of (tonnes) polylactic acid is presented for the regions of Europe, North America, Asia-Pacific and “Rest of the World”. Additionally, the following application areas for the bioplastic PLA are examined individually:
- Rigid packaging
- Flexible packaging (Bags, Sacks, and other packaging)
- Consumer
- Automotive and Electronics
- Textiles and fibers
- Other applications
In Chapter 2, the countries with the largest PLA sales are considered individually: Germany, France, United Kingdom, Italy, the Netherlands, Spain, the USA, China, Japan, South Korea and Taiwan. In each case the demand and revenues as well as demand for the individual applications are presented.
Chapter 3 provides useful company profiles of the top producers of PLA, clearly arranged by contact details, revenues, profit, product range, production sites and brief profile. Detailed profiles are supplied by 47 manufacturers, for example, Evonik Industries AG, Nature Works LLC, Futerro, Bewi Synbra Technology, Total Corbion, and Danimer Scientific LLC
Scope of the Report:
Attributes | Details |
| Base Year | 2022 |
| Trend Period | 2020 – 2032 |
| Forecast Period | 2023 – 2032 |
| Pages | 160 |
| Application Areas | Rigid Packaging, Flexible Packaging, Consumer, Automotive and Electronics, Textiles and Fibers, Other Applications |
| Company Profiles | Alpek, BASF, Flint Hills, Loyal, Ming Dih, Nova Chemicals, SIBUR, Sunpor, SPL, Synthos, and Wuxi Xingda (Selection) |
| Edition | 1st edition |
| Publication | March 2023 |
FAQs
How will PLA sales develop up until 2032?
PLA sales will reach around USD 3.7 billion worldwide by 2032.
Which region is going to have the highest production volume of PLA?
By 2032, Ceresana expects more than two-thirds of global PLA production to take place in Asia.
Which application area has the highest PLA demand?
The packaging industry is currently the most important market for PLA with a share of around 65%.
1 Market Data: World and Regions
1.1 World
1.1.1 Demand
1.1.2 Revenues
1.1.3 Production
1.1.4 Demand Split by Application Area
1.2 Europe
1.2.1 Demand
1.2.2 Revenues
1.2.3 Production
1.2.4 Applications
1.3 North America
1.3.1 Demand
1.3.2 Revenues
1.3.3 Production
1.3.4 Applications
1.4 Asia-Pacific
1.4.1 Demand
1.4.2 Revenues
1.4.3 Production
1.4.4 Applications
1.5 Rest of the World
1.5.1 Demand
1.5.2 Revenues
1.5.3 Applications
2 Market Data: Countries
2.1 Europe
2.1.1 France
2.1.2 Germany
2.1.3 Italy
2.1.4 Spain
2.1.5 The Netherlands
2.1.6 United Kingdom
2.1.7 Rest of Europe
2.2 North America
2.2.1 Canada / Mexico
2.2.2 USA
2.3 Asia-Pacific
2.3.1 China
2.3.2 Japan
2.3.3 South Korea
2.3.4 Taiwan
2.3.5 Other Asia-Pacific
3 Company Profiles
2.1 Europe
Belgium (2 Producer)
Finland (2)
Germany (7)
Italy (2)
Spain (2)
Sweden (1)
The Netherlands (1)
United Kingdom (1)
Norway (1)
2.2 North America
USA (3)
2.3 Asia-Pacific
Japan (5)
South Korea (3)
Taiwan (2)
Israel (1)
Graph 1: Global demand from 2020 to 2032
Graph 2: Global demand from 2020 to 2032 – split by region
Graph 3: Global revenues from 2020 to 2032 in million USD and million EUR
Graph 4: Global revenues from 2020 to 2032 in million USD – split by region
Graph 5: Global revenues from 2020 to 2032 in million EUR – split by region
Graph 6: Global production from 2020 to 2032
Graph 7: Global production from 2020 to 2032 – split by region
Graph 8: Global demand from 2020 to 2032 – split by application
Graph 9: Global demand for PLA in the application area rigid packaging from 2020 to 2032 – split by region
Graph 10: Global demand for PLA in the application area flexible packaging from 2020 to 2032 – split by region
Graph 11: Global demand for PLA in the application area consumer goods from 2020 to 2032 – split by region
Graph 12: Global demand for PLA in the application area automotive / E&E from 2020 to 2032 – split by region
Graph 13: Global demand for PLA in the application area textiles / fibers from 2020 to 2032 – split by region
Graph 14: Global demand for PLA in other application areas from 2020 to 2032 – split by region
Graph 15: Demand in Europe from 2020 to 2032
Graph 16: Revenues generated in Europe from 2020 to 2032 in million USD and million EUR
Graph 17: Production in Europe from 2020 to 2032
Graph 18: Demand in Europe from 2020 to 2032 – split by application
Graph 19: Demand in North America from 2020 to 2032
Graph 20: Revenues generated in North America from 2020 to 2032 in million USD and million EUR
Graph 21: Production in North America from 2020 to 2032
Graph 22: Demand in North America from 2020 to 2032 – split by application
Graph 23: Demand in Asia-Pacific from 2020 to 2032
Graph 24: Revenues generated in Asia-Pacific from 2020 to 2032 in million USD and million EUR
Graph 25: Production in Asia-Pacific from 2020 to 2032
Graph 26: Demand in Asia-Pacific from 2020 to 2032 – split by application
Graph 27: Global demand from 2020 to 2032
Graph 28: Revenues generated in the rest of the world from 2020 to 2032 in million USD and million EUR
Graph 29: Demand in the rest of the world from 2020 to 2032 – split by application
Graph 30: Demand in France from 2020 to 2032
Graph 31: Demand in Germany from 2020 to 2032
Graph 32: Demand in Italy from 2020 to 2032
Graph 33: Demand in Spain from 2020 to 2032
Graph 34: Demand in the Netherlands from 2020 to 2032
Graph 35: Demand in the United Kingdom from 2020 to 2032
Graph 36: Demand in the rest of Europe from 2020 to 2032
Graph 37: Demand in Canada and Mexico from 2020 to 2032
Graph 38: Demand in the USA from 2020 to 2032
Graph 39: Demand in China from 2020 to 2032
Graph 40: Demand in Japan from 2020 to 2032
Graph 41: Demand in South Korea from 2020 to 2032
Graph 42: Demand in Taiwan from 2020 to 2032
Graph 43: Demand in the remaining countries of Asia-Pacific from 2020 to 2032
Table 1: Global demand from 2020 to 2032 – split by region
Table 2: Global revenues from 2020 to 2032 in million USD – split by region
Table 3: Global revenues from 2020 to 2032 in million EUR – split by region
Table 4: Global production from 2020 to 2032 – split by region
Table 5: Global demand from 2020 to 2032 – split by application
Table 6: Global demand for PLA in the application area rigid packaging from 2020 to 2032 – split by region
Table 7: Global demand for PLA in the application area flexible packaging from 2020 to 2032 – split by region
Table 8: Global demand for PLA in the application area consumer goods from 2020 to 2032 – split by region
Table 9: Global demand for PLA in the application area automotive / E&E from 2020 to 2032 – split by region
Table 10: Global demand for PLA in the application area textiles / fibers from 2020 to 2032 – split by region
Table 11: Global demand for PLA in other application areas from 2020 to 2032 – split by region
Table 12: Demand in Europe from 2020 to 2032 – split by major country
Table 13: Revenues generated in Europe from 2020 to 2032 in million USD and million EUR
Table 14: Demand in Europe from 2020 to 2032 – split by application
Table 15: Demand in North America from 2020 to 2032 – split by major country
Table 16: Revenues generated in North America from 2020 to 2032 in million USD and million EUR
Table 17: Demand in North America from 2020 to 2032 – split by application
Table 18: Demand in Asia-Pacific from 2020 to 2032 – split by major country
Table 19: Revenues generated in Asia-Pacific from 2020 to 2032 in million USD and million EUR
Table 20: Demand in Asia-Pacific from 2020 to 2032 – split by application
Table 21: Revenues generated in the rest of the world from 2020 to 2032 in million USD and million EUR
Table 22: Demand in the rest of the world from 2020 to 2032 – split by application
Table 23: Revenues generated in France from 2020 to 2032 in million USD and million EUR
Table 24: Demand in France from 2020 to 2032 – split by application
Table 25: Revenues in Germany from 2020 to 2032 in million USD and million EUR
Table 26: Demand in Germany from 2020 to 2032 – split by application
Table 27: Revenues generated in Italy from 2020 to 2032 in million USD and million EUR
Table 28: Demand in Italy from 2020 to 2032 – split by application
Table 29: Revenues in Spain from 2020 to 2032 in million USD and million EUR
Table 30: Demand in Spain from 2020 to 2032 – split by application
Table 31: Revenues generated in the Netherlands from 2020 to 2032 in million USD and million EUR
Table 32: Demand in the Netherlands from 2020 to 2032 – split by application
Table 33: Revenues in the United Kingdom from 2020 to 2032 in million USD and million EUR
Table 34: Demand in the United Kingdom from 2020 to 2032 – split by application
Table 35: Revenues generated in the remaining countries of Europe from 2020 to 2032 in million USD and million EUR
Table 36: Demand in the remaining European countries from 2020 to 2032 – split by application
Table 37: Revenues generated in Canada and Mexico from 2020 to 2032 in million USD and million EUR
Table 38: Demand in Canada and Mexico from 2020 to 2032 – split by application
Table 39: Revenues generated in the USA from 2020 to 2032 in million USD and million EUR
Table 40: Demand in the USA from 2020 to 2032 – split by application
Table 41: Revenues generated in China from 2020 to 2032 in million USD and million EUR
Table 42: Demand in China from 2020 to 2032 – split by application
Table 43: Revenues in Japan from 2020 to 2032 in million USD and million EUR
Table 44: Demand in Japan from 2020 to 2032 – split by application
Table 45: Revenues generated in South Korea from 2020 to 2032 in million USD and million EUR
Table 46: Demand in South Korea from 2020 to 2032 – split by application
Table 47: Revenues generated in Taiwan from 2020 to 2032 in million USD and million EUR
Table 48: Demand in Taiwan from 2020 to 2032 – split by application
Table 49: Revenues in the remaining countries of Asia-Pacific from 2020 to 2032 in million USD and million EUR
Table 50: Demand in the remaining countries of Asia-Pacific from 2020 to 2032 – split by application


