

Description
The Polyethylene – LLDPE Market Report – World is now also available in parts (e.g. individual country profiles or all manufacturer profiles). Please feel free to contact us and we will immediately send you an offer for your specific selection.
Linear low-density polyethylene (LLDPE) is one of the most widely used types of standard plastics. Other varieties of polyethylene, especially LDPE and HDPE, are sometimes easier to process; however, LLDPE is more flexible and has a higher resistance against tearing, shocks, and punctures. These special properties are the result of the manufacturing process: copolymerization with alkenes at low temperatures and low pressure results in polymer chains with short branches only.
Ceresana releases its third comprehensive report on the global market for linear low-density polyethylene.
Bags for China
LLDPE films can be produced with reduced thickness, therefore saving considerable amounts of materials. Carrier bags, pouches, packaging materials, and agricultural covering films can be made of LLDPE, among others. The present study expects average growth of approx. 4.1% per year in the global demand for LLDPE until 2026. With a share of 51% of global demand volumes, the region Asia-Pacific is by far the largest consumer of LLDPE.
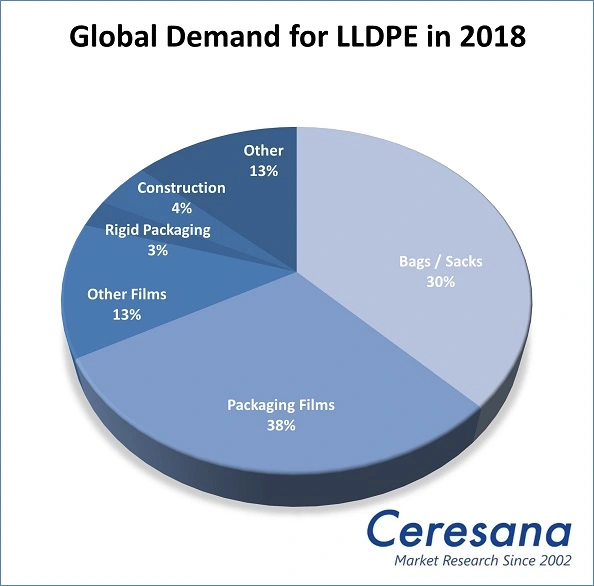
Packaging Films are the Main Application
The most important sales market for LLDPE in 2018 was the application area “packaging films” with demand of 11.46 million tonnes, followed by bags and sacks. The entire packaging market, including rigid packaging, currently amounts to around 70% of total demand. However, more and more polyethylene of this type is used for other applications: the demand for LLDPE for the production of vehicles, toys, electronic and electrical devices, household appliances, medical technology, as well as mechanical and plant engineering will presumably achieve the highest percentage increases until 2026 with rates of 3.0% per year.
Processing by Means of Extrusion Dominates Market
The most important processing method for LLDPE is extrusion. More than 24.3 million tonnes of LDPE were processed around the globe in 2018 by means of film extrusion alone. Analysts at Ceresana expect that the global extrusion of pipes, profiles, and cables will achieve the highest growth during the next eight years with rates of 3.1% per year.
The Study in Brief:
Chapter 1 provides a comprehensive account and analysis of the global market for linear low-density polyethylene (LLDPE) – including forecasts until 2026. It features the development of demand (in tonnes), revenues (in USD and EUR), and production (in tonnes) for each region.
The application areas of LLDPE are also examined. We distinguish between:
- Packaging Films
- Bags and Sacks
- Other Films
- Rigid Packaging
- Construction Products
- Other Applications
Chapter 2 analyses 26 individual sales markets: Belgium, Germany, France, the United Kingdom, Italy, the Netherlands, Spain, Poland, Russia, Turkey, Canada, Mexico, USA, Argentina, Brazil, China, India, Indonesia, Japan, Malaysia, South Korea, Taiwan, Thailand, Iran, Saudi Arabia, and South Africa. The following criteria are described for each individual country:
- Total demand
- Total revenues
- Export and Import
- Production
- Demand per application area
- Revenues per application area
- Demand per technology:
- Film extrusion
- Other extrusion
- Injection molding
- Other technologies.
Chapter 3 provides useful company profiles of the most important manufacturers of LLDPE, clearly arranged according to contact information, revenues, profits, product range, production sites, capacities, and profile summary. We offer comprehensive profiles of 69 manufacturers, such as China Petroleum & Chemical Corp. (Sinopec Corp.), Dow Inc., Equate Petrochemical Company, ExxonMobil Corporation, Gas Authority of India Ltd. (GAIL), and Saudi Basic Industries Corp. (SABIC).
Scope of the Report:
Attributes | Details |
| Base Year | 2018 |
| Trend Period | 2010 – 2026 |
| Forecast Period | 2019 – 2026 |
| Pages | 410 |
| Application Areas | Packaging Films, Bags and Sacks, Other Films, Rigid Packaging, Construction Products, Other Applications |
| Technologies | Film Extrusion, Other Extrusion, Injection Molding, Other Technologies |
| Company Profiles | China Petroleum & Chemical Corp. (Sinopec Corp.), Dow Inc., Equate Petrochemical Company, ExxonMobil Corporation, Gas Authority of India Ltd. (GAIL), and Saudi Basic Industries Corp. (SABIC) (Selection) |
| Edition | 3rd edition |
| Publication | March 2020 |
FAQs
How will LLDPE revenues develop up to the year 2026?
The present study expects average growth of approx. 4.1% per year in the global demand for LLDPE until 2026.
Which region has the highest LLDPE consumption?
With a share of 51% of global demand volumes, the region Asia-Pacific is by far the largest consumer of LLDPE.
What was the largest application area for LLDPE in 2018?
The most important sales market for LLDPE in 2018 was the application area “packaging films” with demand of 11.46 million tonnes, followed by bags and sacks.
Which application areas will show the highest demand growth until 2026?
The demand for LLDPE for the production of vehicles, toys, electronic and electrical devices, household appliances, medical technology, as well as mechanical and plant engineering will presumably achieve the highest percentage increases until 2026 with rates of 3.0% per year.
1 Market Data: World and Regions
1.1 World
1.1.1 Demand
1.1.2 Revenues
1.1.3 Production
1.1.4 Applications
1.1.4.1 Packaging Films
1.1.4.2 Bags and Sacks
1.1.4.3 Other Films
1.1.4.4 Rigid Packaging
1.1.4.5 Construction
1.1.4.6 Other Applications
1.1.5 Technologies
1.1.5.1 Film Extrusion
1.1.5.2 Other Extrusion
1.1.5.3 Injection Molding
1.1.5.4 Other Technologies
1.2 Western Europe
1.2.1 Demand and Revenues
1.2.2 Production
1.2.3 Applications and Technologies
1.3 Eastern Europe
1.3.1 Demand and Revenues
1.3.2 Production
1.3.3 Applications and Technologies
1.4 North America
1.4.1 Demand and Revenues
1.4.2 Production
1.4.3 Applications and Technologies
1.5 South America
1.5.1 Demand and Revenues
1.5.2 Production
1.5.3 Applications and Technologies
1.6 Asia-Pacific
1.6.1 Demand and Revenues
1.6.2 Production
1.6.3 Applications and Technologies
1.7 Middle East
1.7.1 Demand and Revenues
1.7.2 Production
1.7.3 Applications and Technologies
1.8 Africa
1.8.1 Demand and Revenues
1.8.2 Production
1.8.3 Applications and Technologies
2 Market Data: Countries
2.1 Western Europe
2.1.1 Belgium
2.1.2 France
2.1.2.1 Demand and Revenues
2.1.2.2 Production and Trade
2.1.3 Germany
2.1.3.1 Demand and Revenues
2.1.3.2 Production and Trade
2.1.4 Italy
2.1.4.1 Demand and Revenues
2.1.4.2 Production and Trade
2.1.5 Spain
2.1.5.1 Demand and Revenues
2.1.5.2 Production and Trade
2.1.6 United Kingdom
2.1.6.1 Demand and Revenues
2.1.6.2 Production and Trade
2.1.7 The Netherlands
2.1.7.1 Demand and Revenues
2.1.7.2 Production and Trade
2.1.8 Other Western Europe
2.1.8.1 Demand and Revenues
2.1.8.2 Production and Trade
2.2 Eastern Europe
2.2.1 Poland
2.2.2 Russia
2.2.2.1 Demand and Revenues
2.2.2.2 Production and Trade
2.2.3 Turkey
2.2.4 Other Eastern Europe
2.3 North America
2.3.1 Canada
2.3.1.1 Demand and Revenues
2.3.1.2 Production and Trade
2.3.2 Mexico
2.3.2.1 Demand and Revenues
2.3.2.2 Production and Trade
2.3.3 USA
2.3.3.1 Demand and Revenues
2.3.3.2 Production and Trade
2.4 South America
2.4.1 Argentina
2.4.1.1 Demand and Revenues
2.4.1.2 Production and Trade
2.4.2 Brazil
2.4.2.1 Demand and Revenues
2.4.2.2 Production and Trade
2.4.3 Other South America
2.4.3.1 Demand and Revenues
2.4.3.2 Production and Trade
2.5 Asia-Pacific
2.5.1 China
2.5.1.1 Demand and Revenues
2.5.1.2 Production and Trade
2.5.2 India
2.5.2.1 Demand and Revenues
2.5.2.2 Production and Trade
2.5.3 Indonesia
2.5.3.1 Demand and Revenues
2.5.3.2 Production and Trade
2.5.4 Japan
2.5.4.1 Demand and Revenues
2.5.4.2 Production and Trade
2.5.5 Malaysia
2.5.5.1 Demand and Revenues
2.5.5.2 Production and Trade
2.5.6 South Korea
2.5.6.1 Demand and Revenues
2.5.6.2 Production and Trade
2.5.7 Taiwan
2.5.7.1 Demand and Revenues
2.5.7.2 Production and Trade
2.5.8 Thailand
2.5.8.1 Demand and Revenues
2.5.8.2 Production and Trade
2.5.9 Other Asia-Pacific
2.5.9.1 Demand and Revenues
2.5.9.2 Production and Trade
2.6 Middle East
2.6.1 Iran
2.6.1.1 Demand and Revenues
2.6.1.2 Production and Trade
2.6.2 Saudi Arabia
2.6.2.1 Demand and Revenues
2.6.2.2 Production and Trade
2.6.3 Other Middle East
2.6.3.1 Demand and Revenues
2.6.3.2 Production and Trade
2.7 Africa
2.7.1 South Africa
2.7.1.1 Demand and Revenues
2.7.1.2 Production and Trade
2.7.2 Other Africa
2.7.2.1 Demand and Revenues
2.7.2.2 Production and Trade
3 Company Profiles*
3.1 Western Europe
Austria (1 Producer)
France (1)
Italy (1)
Spain (1)
The Netherlands (2)
United Kingdom (1)
3.2 Eastern Europe
Russia (2)
3.3 North America
Canada (2)
Mexico (1)
USA (5)
3.4 South America
Brazil (1)
Venezuela (1)
3.5 Asia-Pacific
China (7)
Hong Kong (1)
India (6)
Indonesia (1)
Japan (8)
Malaysia (1)
Philippines (2)
South Korea (5)
Taiwan (2)
Thailand (3)
3.6 Middle East
Azerbaijan (1)
Iran (1)
Kuwait (2)
Qatar (2)
Saudi Arabia (4)
United Arab Emirates (1)
3.7 Africa
Egypt (2)
South Africa (1)
*Note: The profiles are assigned to the country in which the company or holding is headquartered. Profiles also include JVs and subsidiaries.
Graph 1: Global demand for LLDPE from 2010 to 2026
Graph 2: Global demand for LLDPE from 2010 to 2026 – split by regions
Graph 3: Global revenues generated with LLDPE from 2010 to 2026 in billion USD and billion EUR
Graph 4: Global revenues generated with LLDPE from 2010 to 2026 in billion USD – split by regions
Graph 5: Global revenues generated with LLDPE from 2010 to 2026 in billion EUR – split by regions
Graph 6: Global production of LLDPE from 2010 to 2026
Graph 7: Global production of LLDPE from 2010 to 2026 – split by regions
Graph 8: Global demand for LLDPE from 2010 to 2026 – split by applications
Graph 9: Global demand for LLDPE in the segment packaging films from 2010 to 2026 – split by regions
Graph 10: Global demand for LLDPE in the segment bags and sacks from 2010 to 2026 – split by regions
Graph 11: Global demand for LLDPE in the segment other films from 2010 to 2026 – split by regions
Graph 12: Global demand for LLDPE in the segment rigid packaging from 2010 to 2026 – split by regions
Graph 13: Global demand for LLDPE in the segment construction from 2010 to 2026 – split by regions
Graph 14: Global demand for LLDPE in the segment other applications from 2010 to 2026 – split by regions
Graph 15: Demand for LLDPE in Western Europe from 2010 to 2026
Graph 16: Revenues generated with LLDPE in Western Europe from 2010 to 2026 in billion USD and billion EUR
Graph 17: Production of LLDPE in Western Europe from 2010 to 2026
Graph 18: Demand for LLDPE in Western Europe from 2010 to 2026 – split by applications
Graph 19: Demand for LLDPE in Eastern Europe from 2010 to 2026
Graph 20: Revenues generated with LLDPE in Eastern Europe from 2010 to 2026 in billion USD and billion EUR
Graph 21: Production of LLDPE in Eastern Europe from 2010 to 2026
Graph 22: Demand for LLDPE in Eastern Europe from 2010 to 2026 – split by applications
Graph 23: Demand for LLDPE in North America from 2010 to 2026
Graph 24: Revenues generated with LLDPE in North America from 2010 to 2026 in billion USD and billion EUR
Graph 25: Production of LLDPE in North America from 2010 to 2026
Graph 26: Demand for LLDPE in North America from 2010 to 2026 – split by applications
Graph 27: Demand for LLDPE in South America from 2010 to 2026
Graph 28: Revenues generated with LLDPE in South America from 2010 to 2026 in billion USD and billion EUR
Graph 29: Production of LLDPE in South America from 2010 to 2026
Graph 30: Demand for LLDPE in South America from 2010 to 2026 – split by applications
Graph 31: Demand for LLDPE in Asia-Pacific from 2010 to 2026
Graph 32: Revenues generated with LLDPE in Asia-Pacific from 2010 to 2026 in billion USD and billion EUR
Graph 33: Production of LLDPE in Asia-Pacific from 2010 to 2026
Graph 34: Demand for LLDPE in Asia-Pacific from 2010 to 2026 – split by applications
Graph 35: Demand for LLDPE in the Middle East from 2010 to 2026
Graph 36: Revenues generated with LLDPE in the Middle East from 2010 to 2026 in billion USD and billion EUR
Graph 37: Production of LLDPE in the Middle East from 2010 to 2026
Graph 38: Demand for LLDPE in the Middle East from 2010 to 2026 – split by applications
Graph 39: Demand for LLDPE in Africa from 2010 to 2026
Graph 40: Revenues generated with LLDPE in Africa from 2010 to 2026 in billion USD and billion EUR
Graph 41: Production of LLDPE in Africa from 2010 to 2026
Graph 42: Demand for LLDPE in Africa from 2010 to 2026 – split by applications
Graph 43: Demand for LLDPE in Belgium from 2010 to 2026
Graph 44: Demand for LLDPE in France from 2010 to 2026
Graph 45: Production of LLDPE in France from 2010 to 2026
Graph 46: Demand for LLDPE in Germany from 2010 to 2026
Graph 47: Production of LLDPE in Germany from 2010 to 2026
Graph 48: Demand for LLDPE in Italy from 2010 to 2026
Graph 49: Production of LLDPE in Italy from 2010 to 2026
Graph 50: Demand for LLDPE in Spain from 2010 to 2026
Graph 51: Production of LLDPE in Spain from 2010 to 2026
Graph 52: Demand for LLDPE in the United Kingdom from 2010 to 2026
Graph 53: Production of LLDPE in the United Kingdom from 2010 to 2026
Graph 54: Demand for LLDPE in the Netherlands from 2010 to 2026
Graph 55: Production of LLDPE in the Netherlands from 2010 to 2026
Graph 56: Demand for LLDPE in the remaining Western European countries from 2010 to 2026
Graph 57: Production of LLDPE in the remaining Western European countries from 2010 to 2026
Graph 58: Demand for LLDPE in Poland from 2010 to 2026
Graph 59: Demand for LLDPE in Russia from 2010 to 2026
Graph 60: Production of LLDPE in Russia from 2010 to 2026
Graph 61: Demand for LLDPE in Turkey from 2010 to 2026
Graph 62: Demand for LLDPE the remaining Eastern European countries from 2010 to 2026
Graph 63: Demand for LLDPE in Canada from 2010 to 2026
Graph 64: Production of LLDPE in Canada from 2010 to 2026
Graph 65: Demand for LLDPE in Mexico from 2010 to 2026
Graph 66: Production of LLDPE in Mexico from 2010 to 2026
Graph 67: Demand for LLDPE in the USA from 2010 to 2026
Graph 68: Production of LLDPE in the USA from 2010 to 2026
Graph 69: Demand for LLDPE in Argentina from 2010 to 2026
Graph 70: Production of LLDPE in Argentina from 2010 to 2026
Graph 71: Demand for LLDPE in Brazil from 2010 to 2026
Graph 72: Production of LLDPE in Brazil from 2010 to 2026
Graph 73: Demand for LLDPE in the remaining South American countries from 2010 to 2026
Graph 74: Production of LLDPE in the remaining South American countries from 2010 to 2026
Graph 75: Demand for LLDPE in China from 2010 to 2026
Graph 76: Production of LLDPE in China from 2010 to 2026
Graph 77: Demand for LLDPE in India from 2010 to 2026
Graph 78: Production of LLDPE in India from 2010 to 2026
Graph 79: Demand for LLDPE in Indonesia from 2010 to 2026
Graph 80: Production of LLDPE in Indonesia from 2010 to 2026
Graph 81: Demand for LLDPE in Japan from 2010 to 2026
Graph 82: Production of LLDPE in Japan from 2010 to 2026
Graph 83: Demand for LLDPE in Malaysia from 2010 to 2026
Graph 84: Production of LLDPE in Malaysia from 2010 to 2026
Graph 85: Demand for LLDPE in South Korea from 2010 to 2026
Graph 86: Production of LLDPE in South Korea from 2010 to 2026
Graph 87: Demand for LLDPE in Taiwan from 2010 to 2026
Graph 88: Production of LLDPE in Taiwan from 2010 to 2026
Graph 89: Demand for LLDPE in Thailand from 2010 to 2026
Graph 90: Production of LLDPE in Thailand from 2010 to 2026
Graph 91: Demand for LLDPE in the remaining countries of Asia-Pacific from 2010 to 2026
Graph 92: Production of LLDPE in the remaining countries of Asia-Pacific from 2010 to 2026
Graph 93: Demand for LLDPE in Iran from 2010 to 2026
Graph 94: Production of LLDPE in Iran from 2010 to 2026
Graph 95: Demand for LLDPE in Saudi Arabia from 2010 to 2026
Graph 96: Production of LLDPE in Saudi Arabia from 2010 to 2026
Graph 97: Demand for LLDPE in the remaining countries in the Middle East from 2010 to 2026
Graph 98: Production of LLDPE in the remaining countries of the Middle East from 2010 to 2026
Graph 99: Demand for LLDPE in South Africa from 2010 to 2026
Graph 100: Production of LLDPE in South Africa from 2010 to 2026
Graph 101: Demand for LLDPE in the remaining African countries from 2010 to 2026
Graph 102: Production of LLDPE in the remaining African countries from 2010 to 2026
Table 1: Global demand for LLDPE from 2010 to 2026 – split by regions
Table 2: Global revenues generated with LLDPE from 2010 to 2026 in million USD – split by regions
Table 3: Global revenues generated with LLDPE from 2010 to 2026 in million EUR – split by regions
Table 4: Global production of LLDPE from 2010 to 2026 – split by regions
Table 5: Global demand for LLDPE from 2010 to 2026 – split by applications
Table 6: Global demand for LLDPE in the segment packaging films from 2010 to 2026 – split by regions
Table 7: Global revenues generated with LLDPE in the segment packaging films from 2010 to 2026 in million USD – split by regions
Table 8: Global demand for LLDPE in the segment bags and sacks from 2010 to 2026 – split by regions
Table 9: Global revenues generated with LLDPE in the segment bags and sacks from 2010 to 2026 in million USD – split by regions
Table 10: Global demand for LLDPE in the segment other films from 2010 to 2026 – split by regions
Table 11: Global revenues generated with LLDPE in the segment other films from 2010 to 2026 in million USD – split by regions
Table 12: Global demand for LLDPE in the segment rigid packaging from 2010 to 2026 – split by regions
Table 13: Global revenues generated with LLDPE in the segment rigid packaging from 2010 to 2026 in million USD – split by regions
Table 14: Global demand for LLDPE in the segment construction from 2010 to 2026 – split by regions
Table 15: Global revenues generated with LLDPE in the segment construction from 2010 to 2026 in million USD – split by regions
Table 16: Global demand for LLDPE in the segment other applications from 2010 to 2026 – split by regions
Table 17: Global revenues generated with LLDPE in the segment other applications from 2010 to 2026 in million USD – split by regions
Table 18: Global demand for LLDPE from 2010 to 2026 – split by technologies
Table 19: Global demand for LLDPE in film extrusion from 2010 to 2026 – split by regions
Table 20: Global demand for LLDPE in other extrusion from 2010 to 2026 – split by regions
Table 21: Global demand for LLDPE in injection molding from 2010 to 2026 – split by regions
Table 22: Global demand for LLDPE in other technologies from 2010 to 2026 – split by regions
Table 23: Revenues generated with LLDPE in Western Europe from 2010 to 2026 in million USD and million EUR
Table 24: Demand for LLDPE in Western Europe from 2010 to 2026 – split by major countries
Table 25: Production of LLDPE in Western Europe from 2010 to 2026 – split by major countries
Table 26: Demand for LLDPE in Western Europe from 2010 to 2026 – split by applications
Table 27: Revenues generated with LLDPE in Western Europe from 2010 to 2026 in million USD – split by applications
Table 28: Demand for LLDPE in Western Europe from 2010 to 2026 – split by technologies
Table 29: Revenues generated with LLDPE in Eastern Europe from 2010 to 2026 in million USD and million EUR
Table 30: Demand for LLDPE in Eastern Europe from 2010 to 2026 – split by major countries
Table 31: Demand for LLDPE in Eastern Europe from 2010 to 2026 – split by applications
Table 32: Revenues generated with LLDPE in Eastern Europe from 2010 to 2026 in million USD – split by applications
Table 33: Demand for LLDPE in Eastern Europe from 2010 to 2026 – split by technologies
Table 34: Revenues generated with LLDPE in North America from 2010 to 2026 in million USD and million EUR
Table 35: Demand for LLDPE in North America from 2010 to 2026 – split by major countries
Table 36: Production of LLDPE in North America from 2010 to 2026 – split by major countries
Table 37: Demand for LLDPE in North America from 2010 to 2026 – split by applications
Table 38: Revenues generated with LLDPE in North America from 2010 to 2026 in million USD – split by applications
Table 39: Demand for LLDPE in North America from 2010 to 2026 – split by technologies
Table 40: Revenues generated with LLDPE in South America from 2010 to 2026 in million USD and million EUR
Table 41: Demand for LLDPE in South America from 2010 to 2026 – split by major countries
Table 42: Production of LLDPE in South America from 2010 to 2026 – split by major countries
Table 43: Demand for LLDPE in South America from 2010 to 2026 – split by applications
Table 44: Revenues generated with LLDPE in South America from 2010 to 2026 in million USD – split by applications
Table 45: Demand for LLDPE in South America from 2010 to 2026 – split by technologies
Table 46: Revenues generated with LLDPE in Asia-Pacific from 2010 to 2026 in million USD and million EUR
Table 47: Demand for LLDPE in Asia-Pacific from 2010 to 2026 – split by major countries
Table 48: Production of LLDPE in Asia-Pacific from 2010 to 2026 – split by major countries
Table 49: Demand for LLDPE in Asia-Pacific from 2010 to 2026 – split by applications
Table 50: Revenues generated with LLDPE in Asia-Pacific from 2010 to 2026 in million USD – split by applications
Table 51: Demand for LLDPE in Asia-Pacific from 2010 to 2026 – split by technologies
Table 52: Revenues generated with LLDPE in the Middle East from 2010 to 2026 in million USD and million EUR
Table 53: Demand for LLDPE in the Middle East from 2010 to 2026 – split by major countries
Table 54: Production of LLDPE in the Middle East from 2010 to 2026 – split by major countries
Table 55: Demand for LLDPE in the Middle East from 2010 to 2026 – split by applications
Table 56: Demand for LLDPE in the Middle East from 2010 to 2026 – split by applications
Table 57: Demand for LLDPE in the Middle East from 2010 to 2026 – split by technologies
Table 58: Revenues generated with LLDPE in Africa from 2010 to 2026 in million USD and million EUR
Table 59: Demand for LLDPE in Africa from 2010 to 2026 – split by major countries
Table 60: Production of LLDPE in Africa from 2010 to 2026 – split by major countries
Table 61: Demand for LLDPE in Africa from 2010 to 2026 – split by applications
Table 62: Revenues generated with LLDPE in Africa from 2010 to 2026 in million USD – split by applications
Table 63: Demand for LLDPE in Africa from 2010 to 2026 – split by technologies
Table 64: Revenues generated with LLDPE in Belgium from 2010 to 2026 in million USD and million EUR
Table 65: Demand for LLDPE in Belgium from 2010 to 2026 – split by applications
Table 66: Revenues generated with LLDPE in Belgium from 2010 to 2026 in million USD – split by applications
Table 67: Demand for LLDPE in Belgium from 2010 to 2026 – split by technologies
Table 68: Revenues generated with LLDPE in France from 2010 to 2026 in million USD and million EUR
Table 69: Demand for LLDPE in France from 2010 to 2026 – split by applications
Table 70: Revenues generated with LLDPE in France from 2010 to 2026 in million USD – split by applications
Table 71: Demand for LLDPE in France from 2010 to 2026 – split by technologies
Table 72: Production, import, and export of and demand for LLDPE in France from 2010 to 2026
Table 73: Revenues generated with LLDPE in Germany from 2010 to 2026 in million USD and million EUR
Table 74: Demand for LLDPE in Germany from 2010 to 2026 – split by applications
Table 75: Revenues generated with LLDPE in Germany from 2010 to 2026 in million USD – split by applications
Table 76: Demand for LLDPE in Germany from 2010 to 2026 – split by technologies
Table 77: Production, import, and export of and demand for LLDPE in Germany from 2010 to 2026
Table 78: Revenues generated with LLDPE in Italy from 2010 to 2026 in million USD and million EUR
Table 79: Demand for LLDPE in Italy from 2010 to 2026 – split by applications
Table 80: Revenues generated with LLDPE in Italy from 2010 to 2026 in million USD – split by applications
Table 81: Demand for LLDPE in Italy from 2010 to 2026 – split by technologies
Table 82: Production, import, and export of and demand for LLDPE in Italy from 2010 to 2026
Table 83: Revenues generated with LLDPE in Spain from 2010 to 2026 in million USD and million EUR
Table 84: Demand for LLDPE in Spain from 2010 to 2026 – split by applications
Table 85: Revenues generated with LLDPE in Spain from 2010 to 2026 in million USD – split by applications
Table 86: Demand for LLDPE in Spain from 2010 to 2026 – split by technologies
Table 87: Production, import, and export of and demand for LLDPE in Spain from 2010 to 2026
Table 88: Revenues generated with LLDPE in the United Kingdom from 2010 to 2026 in million USD and million EUR
Table 89: Demand for LLDPE in the United Kingdom from 2010 to 2026 – split by applications
Table 90: Revenues generated with LLDPE in the United Kingdom from 2010 to 2026 in million USD – split by applications
Table 91: Demand for LLDPE in the United Kingdom from 2010 to 2026 – split by technologies
Table 92: Production, import, and export of and demand for LLDPE in the United Kingdom from 2010 to 2026
Table 93: Revenues generated with LLDPE in the Netherlands from 2010 to 2026 in million USD and million EUR
Table 94: Demand for LLDPE in the Netherlands from 2010 to 2026 – split by applications
Table 95: Revenues generated with LLDPE in the Netherlands from 2010 to 2026 in million USD – split by applications
Table 96: Demand for LLDPE in the Netherlands from 2010 to 2026 – split by technologies
Table 97: Production, import, and export of and demand for LLDPE in the Netherlands from 2010 to 2026
Table 98: Revenues generated with LLDPE in the remaining Western European countries from 2010 to 2026 in million USD and million EUR
Table 99: Demand for LLDPE in the remaining Western European countries from 2010 to 2026 – split by applications
Table 100: Revenues generated with LLDPE in the remaining Western European countries from 2010 to 2026 in million USD – split by applications
Table 101: Demand for LLDPE in the remaining Western European countries from 2010 to 2026 – split by technologies
Table 102: Production, import, and export of and demand for LLDPE in the remaining Western European countries from 2010 to 2026
Table 103: Revenues generated with LLDPE in Poland from 2010 to 2026 in million USD and million EUR
Table 104: Demand for LLDPE in Poland from 2010 to 2026 – split by applications
Table 105: Revenues generated with LLDPE in Poland from 2010 to 2026 in million USD – split by applications
Table 106: Demand for LLDPE in Poland from 2010 to 2026 – split by technologies
Table 107: Revenues generated with LLDPE in Russia from 2010 to 2026 in million USD and million EUR
Table 108: Demand for LLDPE in Russia from 2010 to 2026 – split by applications
Table 109: Revenues generated with LLDPE in Russia from 2010 to 2026 in million USD – split by applications
Table 110: Demand for LLDPE in Russia from 2010 to 2026 – split by technologies
Table 111: Production, import, and export of and demand for LLDPE in Russia from 2010 to 2026
Table 112: Revenues generated with LLDPE in Turkey from 2010 to 2026 in million USD and million EUR
Table 113: Demand for LLDPE in Turkey 2010 to 2026 – split by applications
Table 114: Revenues generated with LLDPE in Turkey from 2010 to 2026 in million USD – split by applications
Table 115: Demand for LLDPE in Turkey from 2010 to 2026 – split by technologies
Table 116: Revenues generated with LLDPE in the remaining Eastern European countries from 2010 to 2026 in billion USD and billion EUR
Table 117: Demand for LLDPE in the remaining Eastern European countries from 2010 to 2026 – split by applications
Table 118: Revenues generated with LLDPE in the remaining Eastern European countries from 2010 to 2026 in million USD – split by applications
Table 119: Demand for LLDPE in the remaining Eastern European countries from 2010 to 2026 – split by technologies
Table 120: Revenues generated with LLDPE in Canada from 2010 to 2026 in million USD and million EUR
Table 121: Demand for LLDPE in Canada from 2010 to 2026 – split by applications
Table 122: Revenues generated with LLDPE in Canada from 2010 to 2026 in million USD – split by applications
Table 123: Demand for LLDPE in Canada from 2010 to 2026 – split by technologies
Table 124: Production, import, and export of and demand for LLDPE in Canada from 2010 to 2026
Table 125: Revenues generated with LLDPE in Mexico from 2010 to 2026 in million USD and million EUR
Table 126: Demand for LLDPE in Mexico from 2010 to 2026 – split by applications
Table 127: Revenues generated with LLDPE in Mexico from 2010 to 2026 in million USD – split by applications
Table 128: Demand for LLDPE in Mexico from 2010 to 2026 – split by technologies
Table 129: Production, import, and export of and demand for LLDPE in Mexico from 2010 to 2026
Table 130: Revenues generated with LLDPE in the USA from 2010 to 2026 in million USD and million EUR
Table 131: Demand for LLDPE in the USA from 2010 to 2026 – split by applications
Table 132: Revenues generated with LLDPE in the USA from 2010 to 2026 in million USD – split by applications
Table 133: Demand for LLDPE in the USA from 2010 to 2026 – split by technologies
Table 134: Production, import, and export of and demand for LLDPE in the USA from 2010 to 2026
Table 135: Revenues generated with LLDPE in Argentina from 2010 to 2026 in million USD and million EUR
Table 136: Demand for LLDPE in Argentina from 2010 to 2026 – split by applications
Table 137: Revenues generated with LLDPE in Argentina from 2010 to 2026 in million USD – split by applications
Table 138: Demand for LLDPE in Argentina from 2010 to 2026 – split by technologies
Table 139: Production, import, and export of and demand for LLDPE in Argentina from 2010 to 2026
Table 140: Revenues generated with LLDPE in Brazil from 2010 to 2026 in million USD and million EUR
Table 141: Demand for LLDPE in Brazil from 2010 to 2026 – split by applications
Table 142: Revenues generated with LLDPE in Brazil from 2010 to 2026 in million USD – split by applications
Table 143: Demand for LLDPE in Brazil from 2010 to 2026 – split by technologies
Table 144: Production, import, and export of and demand for LLDPE in Brazil from 2010 to 2026
Table 145: Revenues generated with LLDPE in the remaining South American countries from 2010 to 2026 in million USD and million EUR
Table 146: Demand for LLDPE in the remaining South American countries from 2010 to 2026 – split by applications
Table 147: Revenues generated with LLDPE in the remaining South American countries from 2010 to 2026 in million USD – split by applications
Table 148: Demand for LLDPE in the remaining South American countries from 2010 to 2026 – split by technologies
Table 149: Production, import, and export of and demand for LLDPE in the remaining South American countries from 2010 to 2026
Table 150: Revenues generated with LLDPE in China from 2010 to 2026 in million USD and million EUR
Table 151: Demand for LLDPE in China from 2010 to 2026 – split by applications
Table 152: Revenues generated with LLDPE in China from 2010 to 2026 in million USD – split by applications
Table 153: Demand for LLDPE in China from 2010 to 2026 – split by technologies
Table 154: Production, import, and export of and demand for LLDPE in China from 2010 to 2026
Table 155: Revenues generated with LLDPE in India from 2010 to 2026 in million USD and million EUR
Table 156: Demand for LLDPE in India from 2010 to 2026 – split by applications
Table 157: Revenues generated with LLDPE in India from 2010 to 2026 in million USD – split by applications
Table 158: Demand for LLDPE in India from 2010 to 2026 – split by technologies
Table 159: Production, import, and export of and demand for LLDPE in India from 2010 to 2026
Table 160: Revenues generated with LLDPE in Indonesia from 2010 to 2026 in million USD and million EUR
Table 161: Demand for LLDPE in Indonesia from 2010 to 2026 – split by applications
Table 162: Revenues generated with LLDPE in Indonesia from 2010 to 2026 in million USD – split by applications
Table 163: Demand for LLDPE in Indionesia from 2010 to 2026 – split by technologies
Table 164: Production, import, and export of and demand for LLDPE in Indonesia from 2010 to 2026
Table 165: Revenues generated with LLDPE in Japan from 2010 to 2026 in million USD and million EUR
Table 166: Demand for LLDPE in Japan from 2010 to 2026 – split by applications
Table 167: Revenues generated with LLDPE in Japan from 2010 to 2026 in million USD – split by applications
Table 168: Demand for LLDPE in Japan from 2010 to 2026 – split by technologies
Table 169: Production, import, and export of and demand for LLDPE in Japan from 2010 to 2026
Table 170: Revenues generated with LLDPE in Malaysia from 2010 to 2026 in million USD and million EUR
Table 171: Demand for LLDPE in Malaysia from 2010 to 2026 – split by applications
Table 172: Revenues generated with LLDPE in Malaysia from 2010 to 2026 in million USD – split by applications
Table 173: Demand for LLDPE in Malaysia from 2010 to 2026 – split by technologies
Table 174: Production, import, and export of and demand for LLDPE in Malaysia from 2010 to 2026
Table 175: Revenues generated with LLDPE in South Korea from 2010 to 2026 in million USD and million EUR
Table 176: Demand for LLDPE in South Korea from 2010 to 2026 – split by applications
Table 177: Revenues generated with LLDPE in South Korea from 2010 to 2026 in million USD – split by applications
Table 178: Demand for LLDPE in South Korea from 2010 to 2026 – split by technologies
Table 179: Production, import, and export of and demand for LLDPE in South Korea from 2010 to 2026
Table 180: Revenues generated with LLDPE in Taiwan from 2010 to 2026 in million USD and million EUR
Table 181: Demand for LLDPE in Taiwan from 2010 to 2026 – split by applications
Table 182: Revenues generated with LLDPE in Taiwan from 2010 to 2026 in million USD – split by applications
Table 183: Demand for LLDPE in Taiwan from 2010 to 2026 – split by technologies
Table 184: Production, import, and export of and demand for LLDPE in Taiwan from 2010 to 2026
Table 185: Revenues generated with LLDPE in Thailand from 2010 to 2026 in million USD and million EUR
Table 186: Demand for LLDPE in Thailand from 2010 to 2026 – split by applications
Table 187: Revenues generated with LLDPE in Thailand from 2010 to 2026 in million USD – split by applications
Table 188: Demand for LLDPE in Thailand from 2010 to 2026 – split by technologies
Table 189: Production, import, and export of and demand for LLDPE in Thailand from 2010 to 2026
Table 190: Revenues generated with LLDPE in the remaining countries of Asia-Pacific from 2010 to 2026 in million USD and million EUR
Table 191: Demand for LLDPE in the remaining countries of Asia-Pacific from 2010 to 2026 – split by applications
Table 192: Revenues generated with LLDPE in the remaining Asian-Pacific countries from 2010 to 2026 in billion USD – split by applications
Table 193: Demand for LLDPE in the remaining countries of Asia-Pacific from 2010 to 2026 – split by technologies
Table 194: Production, import, and export of and demand for LLDPE in the remaining countries of Asia-Pacific from 2010 to 2026
Table 195: Revenues generated with LLDPE in Iran from 2010 to 2026 in million USD and million EUR
Table 196: Demand for LLDPE in Iran from 2010 to 2026 – split by applications
Table 197: Revenues generated with LLDPE in Iran from 2010 to 2026 in million USD – split by applications
Table 198: Demand for LLDPE in Iran from 2010 to 2026 – split by technologies
Table 199: Production, import, and export of and demand for LLDPE in Iran from 2010 to 2026
Table 200: Revenues generated with LLDPE in Saudi Arabia from 2010 to 2026 in million USD and million EUR
Table 201: Demand for LLDPE in Saudi Arabia from 2010 to 2026 – split by applications
Table 202: Revenues generated with LLDPE in Saudi Arabia from 2010 to 2026 in million USD – split by applications
Table 203: Demand for LLDPE in Saudi Arabia from 2010 to 2026 – split by technologies
Table 204: Production, import, and export of and demand for LLDPE in Saudi Arabia from 2010 to 2026
Table 205: Revenues generated with LLDPE in the remaining countries in the Middle East from 2010 to 2026 in million USD and million EUR
Table 206: Demand for LLDPE in the remaining countries in the Middle East from 2010 to 2026 – split by applications
Table 207: Revenues generated with LLDPE in the remaining countries in the Middle East from 2010 to 2026 in billion USD – split by applications
Table 208: Demand for LLDPE in the remaining countries in the Middle East from 2010 to 2026 – split by technologies
Table 209: Production, import, and export of and demand for LLDPE in the remaining countries in the Middle East from 2010 to 2026
Table 210: Revenues generated with LLDPE in South Africa from 2010 to 2026 in million USD and million EUR
Table 211: Demand for LLDPE in South Africa from 2010 to 2026 – split by applications
Table 212: Revenues generated with LLDPE in South Africa from 2010 to 2026 in million USD – split by applications
Table 213: Demand for LLDPE in South Africa from 2010 to 2026 – split by technologies
Table 214: Production, import, and export of and demand for LLDPE in South Africa from 2010 to 2026
Table 215: Revenues generated with LLDPE in the remaining African countries from 2010 to 2026 in million USD and million EUR
Table 216: Demand for LLDPE in the remaining African countries from 2010 to 2026 – split by applications
Table 217: Revenues generated with LLDPE in the remaining African countries from 2010 to 2026 in million USD – split by applications
Table 218: Demand for LLDPE in the remaining African countries from 2010 to 2026 – split by technologies
Table 219: Production, import, and export of and demand for LLDPE in the remaining African countries from 2010 to 2026


