

Description
The Plastic Pipes Market Report – Europe is now also available in parts (e.g. individual country profiles or all manufacturer profiles). Please feel free to contact us and we will immediately send you an offer for your specific selection.
Customer Experience: Measurable Success With Our Study
Success Story: Looking Closer in a Volatile Environment
How a Global Energy Company Gained Strategic Insights in the European Pipe Market
A European Business Development Manager from one of the leading energy companies in Western Europe faced the challenge of keeping a clear and accurate view of demand fluctuations in the increasingly volatile plastic pipe industry. To stay ahead of shifting market trends, the company turned to a data-driven approach. As part of this strategy, it acquired Ceresana’s European plastic pipes market study to gain deeper insights into regional demand trends and application dynamics.
The decision to focus on the plastic pipes market was driven by its crucial role in the infrastructure and construction sector. Given its size and significance, industry players closely track market developments to stay informed about key trends and shifts.
Leveraging the study’s detailed market data, the company identified important changes in local demand patterns. According to the European Business Development Manager, a particularly valuable aspect was the country-specific data breakdown: “Especially the market data per country helped us to identify local demand dynamics, which deviate from the average trends on a pan-European level.”
By incorporating these insights into its market strategy, the company successfully achieved its goal of making well-informed decisions in a rapidly changing environment. The comprehensive evaluation of market developments provided a solid foundation for strategic planning, allowing the company to navigate industry fluctuations with greater confidence. With a clearer understanding of regional demand trends, it adopted a more targeted and proactive approach—ensuring competitiveness and readiness for future market developments.
Will the economic upturn finally come in 2026? There is hope, at least for manufacturers of plastic pipes. For some time, the European market for PVC pipes, polypropylene pipes, and pipes made of other polymers stagnated at around 5 million tonnes per year. However, Ceresana market researchers are now expecting a slight recovery in demand: EU directives on drinking water (DWD) and urban waste water treatment (UWWTD) are gradually coming into force and driving the expansion of water pipe networks. Adapting to climate change and extreme weather events requires investment in new pipes in agriculture and horticulture, but also in many municipalities, for example for pressure pipes, plumbing pipes, or water treatment. In addition, there is a growing need for empty conduits to protect power and telecommunication lines: For cable protection, often made of polyethylene, Ceresana expects growth of 1.7% per year.
Plastic Pipes for Indoor and Outdoor Use
The latest, already eighth edition of Ceresana’s European plastic pipe market report distinguishes for the first time between in-building installations and external utility networks when it comes to the key figures for the two application areas “potable water” and “sewage”. The market volume for in-building installations is heavily dependent on construction activity in the building construction sector and on the energy-efficient refurbishment and modernization of buildings. The trend continues towards lightweight, durable plastics: Old metal pipes are replaced with new pipes made of polypropylene random copolymer (PP-R pipes) or cross-linked polyethylene (PE-X pipes), particularly during renovations. Glass fiber reinforced plastics (GRP) are used in particular for large pipes where rigidity and corrosion resistance are required. The market share of pipes made of fiber composites, mostly mixtures of glass fibers and thermosetting polyester or epoxy resins, is still low. However, Ceresana’s plastic pipes industry analysis expects high growth of around 3% per year for GRP pipes, although the prospects for this depend on a few major projects. Ceresana is forecasting growth of 1.4% for polyethylene pipes, which are used in particular for potable water, irrigation, and parts of gas networks. One of the reasons for the increasing demand for plastic pipes is the trend towards trenchless construction methods, among other things.
Opportunities and Risks for Plastic Pipes
The European construction industry could recover from 2026 onwards. However, many construction projects are held up by bureaucratic approval procedures, a shortage of skilled workers, and rising construction and financing costs. Municipal projects are particularly affected by budget cuts; on the other hand, there are large government investment programs for infrastructure. With a “European Grid Package” and new “energy highways”, the European Union wants to expand the trans-European energy networks, especially the cross-border electricity, gas, and hydrogen pipelines. The market report on plastic pipes examines demand in the various segments of the construction industry separately. In most European countries, commercial, infrastructure, and military buildings are outperforming residential construction. The hype surrounding artificial intelligence is currently causing a boom in the construction of data centers in particular. In addition to market data and forecasts, the new study also contains background information on the regulatory framework in the EU as well as the general economic situation and the situation in the construction industry in various European countries (including important companies, construction activities, investments, planned construction projects).
Current 8th Edition of the European Plastic Pipe Market Study:
Chapter 1 analyzes the entire European market for plastic pipes – and provides forecasts up to the year 2034. Key figures on revenues (in dollars and euros) as well as demand and production volumes (in tonnes) are provided. Revenues are also broken down into application areas. Demand is broken down in detail for the various application areas, construction segments, and plastic types (glass fiber reinforced plastics are covered separately). The production volume is broken down by type of plastic (GRP not shown separately here).
Chapter 2 provides specific market data on plastic pipes for 23 European countries: Revenues, imports and exports, production and demand volumes, broken down as described for chapter 1. The following individual sub-segments are included:
Application areas:
- Sewage
- In-building installations
- External utility networks
- Potable water
- In-building installations
- External utility networks
- Cable protection
- Gas pipes
- Agriculture
- Industry
- Other applications
Types of plastic:
- Polyethylene (PE)
- Polypropylene (PP)
- Polyvinyl chloride (PVC)
- Glass fiber reinforced plastics (GRP)
- Other types of plastic
Construction segments:
- New construction
- Renovation
- Residential construction
- Non-residential construction (commercial construction and infrastructure)
Chapter 3 provides company profiles of the largest plastic pipe manufacturers in Europe – clearly arranged according to contact details, revenues, net income, product range, production sites, and short overview of the company. In-depth profiles of the 59 most important plastic pipe producers are given, for example of Aalberts N.V., Aliaxis S.A, Geberit AG, Georg Fischer AG, Pipelife International GmbH, POLYPLASTIC Group, Rehau Industries SE & Co. KG, Tessenderlo Group nv, Viega GmbH & Co. KG, and Wavin B.V.
=> Ceresana regularly analyzes the markets for plastics, including individual types of plastics, plastic additives, and plastic applications. A recent study by Ceresana covers the global plastic pipes market. New Ceresana market studies on windows and doors, paints and coatings, insulating materials, and adhesives, for example, are also particularly relevant for the construction industry. A focus of Ceresana’s market research is on bio-based products. Ceresana also organizes online events on the bio-economy, for example in spring 2026 on bio-based adhesives and bio-based paints and coatings.
Scope of the Report:
Attributes | Details |
Base Year | 2024 |
Trend Period | 2022 – 2034 |
Forecast Period | 2025 – 2034 |
Pages | 390 |
Product Type | Polyethylene (PE), polypropylene (PP), polyvinyl chloride (PVC), glass fiber reinforced plastics (GRP), other plastics |
Application Areas | Sewage, potable water, cable protection, gas, agriculture, industry, others |
Construction Segments | New construction, renovation, residential construction, as well as commercial construction and infrastructure |
Company Profiles | Aalberts, Aliaxis, Geberit, Georg Fischer, Pipelife, POLYPLASTIC, Rehau, Tessenderlo, Viega, and Wavin (Selection) |
Edition | 8th edition |
Publication | January 2026 |
FAQs
How big is the European market for plastic pipes?
The European market for plastic pipes stagnated at around 5 million tonnes per year.
Which product type will see the strongest growth in Europe?
Pipes made of fiber-reinforced composites (GRP pipes) are currently the market segment with the most dynamic growth.
Which area of application will see the greatest growth in importance for plastic pipes in the coming years?
For cable protection, Ceresana expects growth of 1.7% per year.
1 Market Data: Europe
1.1 Demand
1.2 Revenues
1.3 Production
1.4 Demand Split by Application Area
1.4.1 Sewage
1.4.1.1 Sewage – In-Building Installations
1.4.1.2 Sewage – External Utility Networks
1.4.2 Potable Water
1.4.2.1 Potable Water – In-Building Installations
1.4.2.2 Potable Water – External Utility Networks
1.4.3 Cable Protection
1.4.4 Gas
1.4.5 Agriculture
1.4.6 Industry
1.4.7 Other Applications
1.5 Revenues Split by Application Area
1.5.1 Sewage
1.5.1.1 Sewage – In-Building Installations
1.5.1.2 Sewage – External Utility Networks
1.5.2 Potable Water
1.5.2.1 Potable Water – In-Building Installations
1.5.2.2 Potable Water – External Utility Networks
1.5.3 Cable Protection
1.5.4 Gas
1.5.5 Agriculture
1.5.6 Industry
1.5.7 Other Applications
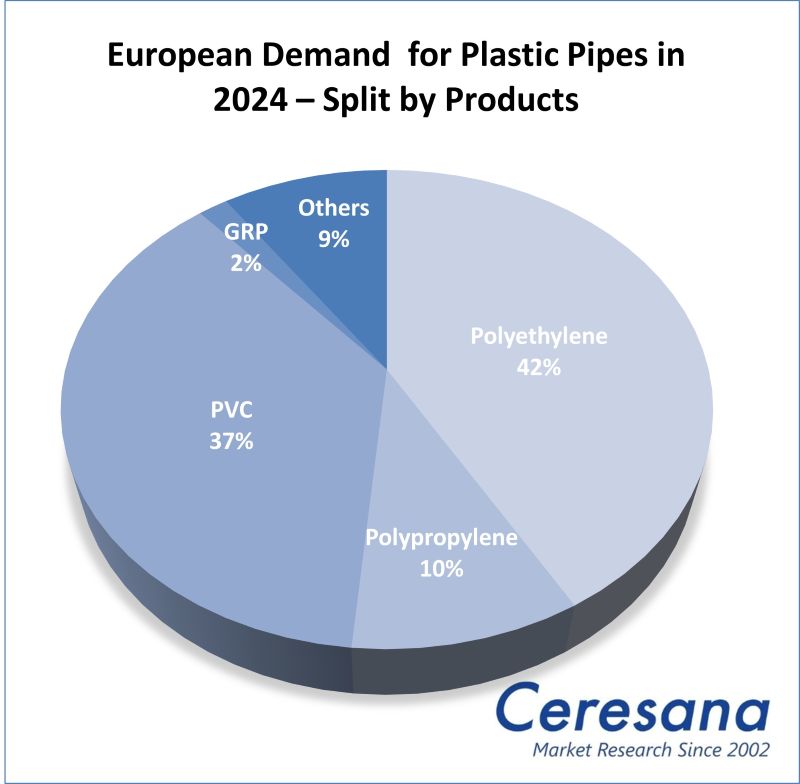
1.6 Demand Split by Product
1.6.1 Polyethylene Pipes
1.6.2 Polypropylene Pipes
1.6.3 PVC Pipes
1.6.4 Glass Fiber Reinforced Plastic Pipes (GRP Pipes)
1.6.5 Pipes Made from Other Plastics
1.7 Demand Split by Construction Segment
1.7.1 New Construction
1.7.2 Renovation
1.7.3 Residential Construction
1.7.4 Non-Residential Construction (Commercial Construction and Infrastructure)
1.8 Production Split by Product
1.8.1 Polyethylene Pipes
1.8.2 Polypropylene Pipes
1.8.3 PVC Pipes
1.8.4 Pipes Made from Other Plastics
1.9 Excursus: Regulations and Directives in the European Union (EU)
1.9.1 General Information
1.9.2 Construction
2 Market Data: Countries
2.1 Austria
2.1.1 Demand and Revenues
2.1.2 Production and Trade
2.2 Belgium
2.2.1 Demand and Revenues
2.2.2 Production and Trade
2.3 Czechia
2.3.1 Demand and Revenues
2.3.2 Production and Trade
2.4 Denmark
2.4.1 Demand and Revenues
2.4.2 Production and Trade
2.5 Finland
2.5.1 Demand and Revenues
2.5.2 Production and Trade
2.6 France
2.6.1 Demand and Revenues
2.6.2 Production and Trade
2.7 Germany
2.7.1 Demand and Revenues
2.7.2 Production and Trade
2.8 Greece
2.8.1 Demand and Revenues
2.8.2 Production and Trade
2.9 Hungary
2.9.1 Demand and Revenues
2.9.2 Production and Trade
2.10 Italy
2.10.1 Demand and Revenues
2.10.2 Production and Trade
2.11 Norway
2.11.1 Demand and Revenues
2.11.2 Production and Trade
2.12 Poland
2.12.1 Demand and Revenues
2.12.2 Production and Trade
2.13 Portugal
2.13.1 Demand and Revenues
2.13.2 Production and Trade
2.14 Romania
2.14.1 Demand and Revenues
2.14.2 Production and Trade
2.15 Russia
2.15.1 Demand and Revenues
2.15.2 Production and Trade
2.16 Serbia
2.16.1 Demand and Revenues
2.16.2 Production and Trade
2.17 Slovakia
2.17.1 Demand and Revenues
2.17.2 Production and Trade
2.18 Spain
2.18.1 Demand and Revenues
2.18.2 Production and Trade
2.19 Sweden
2.19.1 Demand and Revenues
2.19.2 Production and Trade
2.20 Switzerland
2.20.1 Demand and Revenues
2.20.2 Production and Trade
2.21 The Netherlands
2.21.1 Demand and Revenues
2.21.2 Production and Trade
2.22 Türkiye
2.22.1 Demand and Revenues
2.22.2 Production and Trade
2.23 United Kingdom
2.23.1 Demand and Revenues
2.23.2 Production and Trade
2.24 Rest of Europe
2.24.1 Demand and Revenues
2.24.2 Production and Trade
3 Company Profiles*
Austria (4 Producers)
Belgium (3)
Czechia (1)
Denmark (1)
Germany (15)
Italy (7)
Norway (2)
Portugal (1)
Romania (1)
Russia (2)
Serbia (1)
Spain (2)
Sweden (1)
Switzerland (7)
The Netherlands (2)
Türkiye (4)
United Kingdom (5)
*Note: The profiles are assigned to the country in which the company or holding is headquartered. Profiles also include JVs and subsidiaries.
Graph 1: Demand in Europe from 2022 to 2034
Graph 2: Revenues generated in Europe from 2022 to 2034, in billion USD and billion EUR
Graph 3: Production in Europe from 2022 to 2034
Graph 4: Demand in Austria from 2022 to 2034
Graph 5: Production in Austria from 2022 to 2034
Graph 6: Demand in Belgium from 2022 to 2034
Graph 7: Production in Belgium from 2022 to 2034
Graph 8: Demand in Czechia from 2022 to 2034
Graph 9: Production in Czechia from 2022 to 2034
Graph 10: Demand in Denmark from 2022 to 2034
Graph 11: Production in Denmark from 2022 to 2034
Graph 12: Demand in Finland from 2022 to 2034
Graph 13: Production in Finland from 2022 to 2034
Graph 14: Demand in France from 2022 to 2034
Graph 15: Production in France from 2022 to 2034
Graph 16: Demand in Germany from 2022 to 2034
Graph 17: Production in Germany from 2022 to 2034
Graph 18: Demand in Greece from 2022 to 2034
Graph 19: Production in Greece from 2022 to 2034
Graph 20: Demand in Hungary from 2022 to 2034
Graph 21: Production in Hungary from 2022 to 2034
Graph 22: Demand in Italy from 2022 to 2034
Graph 23: Production in Italy from 2022 to 2034
Graph 24: Demand in Norway from 2022 to 2034
Graph 25: Production in Norway from 2022 to 2034
Graph 26: Demand in Poland from 2022 to 2034
Graph 27: Production in Poland from 2022 to 2034
Graph 28: Demand in Portugal from 2022 to 2034
Graph 29: Production in Portugal from 2022 to 2034
Graph 30: Demand in Romania from 2022 to 2034
Graph 31: Production in Romania from 2022 to 2034
Graph 32: Demand in Russia from 2022 to 2034
Graph 33: Production in Russia from 2022 to 2034
Graph 34: Demand in Serbia from 2022 to 2034
Graph 35: Production in Serbia from 2022 to 2034
Graph 36: Demand in Slovakia from 2022 to 2034
Graph 37: Production in Slovakia from 2022 to 2034
Graph 38: Demand in Spain from 2022 to 2034
Graph 39: Production in Spain from 2022 to 2034
Graph 40: Demand in Sweden from 2022 to 2034
Graph 41: Production in Sweden from 2022 to 2034
Graph 42: Demand in Switzerland from 2022 to 2034
Graph 43: Production in Switzerland from 2022 to 2034
Graph 44: Demand in the Netherlands from 2022 to 2034
Graph 45: Production in the Netherlands from 2022 to 2034
Graph 46: Demand in Türkiye from 2022 to 2034
Graph 47: Production in Türkiye from 2022 to 2034
Graph 48: Demand in the United Kingdom from 2022 to 2034
Graph 49: Production in the United Kingdom from 2022 to 2034
Graph 50: Demand in the remaining countries of Europe from 2022 to 2034
Graph 51: Production in the remaining countries of Europe from 2022 to 2034
Table 1: Demand in Europe from 2022 to 2034 – split by country
Table 2: Production in Europe from 2022 to 2034 – split by country
Table 3: Demand in Europe from 2022 to 2034 – split by application
Table 4: Demand in the “sewage” segment in Europe from 2022 to 2034 – split by country
Table 5: Demand in the “sewage – in-building installations” segment in Europe from 2022 to 2034 – split by country
Table 6: Demand in the “sewage – external utility networks” segment in Europe from 2022 to 2034 – split by country
Table 7: Demand in the “potable water” segment in Europe from 2022 to 2034 – split by country
Table 8: Demand in the “potable water – in-building installations” segment in Europe from 2022 to 2034 – split by country
Table 9: Demand in the “potable water – external utility networks” segment in Europe from 2022 to 2034 – split by country
Table 10: Demand in the “cable protection” segment in Europe from 2022 to 2034 – split by country
Table 11: Demand in the “gas” segment in Europe from 2022 to 2034 – split by country
Table 12: Demand in the “agriculture” segment in Europe from 2022 to 2034 – split by country
Table 13: Demand in the “industry” segment in Europe from 2022 to 2034 – split by country
Table14: Demand in the “other applications” segment in Europe from 2022 to 2034 – split by country
Table 15: Revenues generated in Europe from 2022 to 2034 – split by application
Table 16: Revenues generated in the “sewage” segment in Europe from 2022 to 2034 – split by country
Table 17: Revenues generated in the “sewage – in-building installations” segment in Europe from 2022 to 2034 – split by country
Table 18: Revenues generated in the “sewage – external utility networks” segment in Europe from 2022 to 2034 – split by country
Table 19: Revenues generated in the “potable water” segment in Europe from 2022 to 2034 – split by country
Table 20: Revenues generated in the “potable water – in-building installations” segment in Europe from 2022 to 2034 – split by country
Table 21: Revenues generated in the “potable water – external utility networks” segment in Europe from 2022 to 2034 – split by country
Table 22: Revenues generated in the “cable protection” segment in Europe from 2022 to 2034 – split by country
Table 23: Revenues generated in the “gas” segment in Europe from 2022 to 2034 – split by country
Table 24: Revenues generated in the “agriculture” segment in Europe from 2022 to 2034 – split by country
Table 25: Revenues generated in the “industry” segment in Europe from 2022 to 2034 – split by country
Table 26: Revenues generated in the “other applications” segment in Europe from 2022 to 2034 – split by country
Table 27: Demand in Europe from 2022 to 2034 – split by product
Table 28: Demand for “polyethylene pipes” in Europe from 2022 to 2034 – split by country
Table 29: Demand for “polypropylene pipes” in Europe from 2022 to 2034 – split by country
Table 30: Demand for “PVC pipes” in Europe from 2022 to 2034 – split by country
Table 31: Demand for “glass fiber reinforced plastic pipes” in Europe from 2022 to 2034 – split by country
Table 32: Demand for “pipes made from other plastics” in Europe from 2022 to 2034 – split by country
Table 33: Demand in Europe from 2022 to 2034 – split by construction segment
Table 34: Demand in the “new construction” segment in Europe from 2022 to 2034 – split by country
Table 35: Demand in the “renovation” segment in Europe from 2022 to 2034 – split by country
Table 36: Demand in the “residential construction” segment in Europe from 2022 to 2034 – split by country
Table 37: Demand in the “non-residential construction (commercial construction and infrastructure)” segment in Europe from 2022 to 2034 – split by country
Table 38: Production in Europe from 2022 to 2034 – split by product
Table 39: Production of “polyethylene pipes” in Europe from 2022 to 2034 – split by country
Table 40: Production of “polypropylene pipes” in Europe from 2022 to 2034 – split by country
Table 41: Production of “PVC pipes” in Europe from 2022 to 2034 – split by country
Table 42: Production of “pipes made from other plastics” in Europe from 2022 to 2034 – split by country
Table 43: Revenues generated in Austria from 2022 to 2034, in million USD and million EUR
Table44: Demand in Austria from 2022 to 2034 – split by product
Table45: Demand in Austria from 2022 to 2034 – split by construction segment
Table46: Production, import, export, and demand in Austria from 2022 to 2034
Table 47: Production in Austria from 2022 to 2034 – split by product
Table 48: Revenues generated in Belgium from 2022 to 2034, in million USD and million EUR
Table 49: Demand in Belgium from 2022 to 2034 – split by product
Table 50: Demand in Belgium from 2022 to 2034 – split by construction segment
Table 51: Production, import, export, and demand in Belgium from 2022 to 2034
Table 52: Production in Belgium from 2022 to 2034 – split by product
Table 53: Revenues generated in Czechia from 2022 to 2034, in million USD and million EUR
Table 54: Demand in Czechia from 2022 to 2034 – split by product
Table 55: Demand in Czechia from 2022 to 2034 – split by construction segment
Table 56: Production, import, export, and demand in Czechia from 2022 to 2034
Table 57: Production in Czechia from 2022 to 2034 – split by product
Table 58: Revenues generated in Denmark from 2022 to 2034, in million USD and million EUR
Table 59: Demand in Denmark from 2022 to 2034 – split by product
Table 60: Demand in Denmark from 2022 to 2034 – split by construction segment
Table 61: Production, import, export, and demand in Denmark from 2022 to 2034
Table 62: Production in Denmark from 2022 to 2034 – split by product
Table 63: Revenues generated in Finland from 2022 to 2034, in million USD and million EUR
Table 64: Demand in Finland from 2022 to 2034 – split by product
Table 65: Demand in Finland from 2022 to 2034 – split by construction segment
Table 66: Production, import, export, and demand in Finland from 2022 to 2034
Table 67: Production in Finland from 2022 to 2034 – split by product
Table 68: Revenues generated in France from 2022 to 2034, in million USD and million EUR
Table 69: Revenues generated in France from 2022 to 2034 – split by application
Table 70: Demand in France from 2022 to 2034 – split by application
Table 71: Demand in France from 2022 to 2034 – split by product
Table 72: Demand in France from 2022 to 2034 – split by construction segment
Table 73: Production, import, export, and demand in France from 2022 to 2034
Table 74: Production in France from 2022 to 2034 – split by product
Table 75: Revenues generated in Germany from 2022 to 2034, in million USD and million EUR
Table 76: Revenues generated in Germany from 2022 to 2034 – split by application
Table 77: Demand in Germany from 2022 to 2034 – split by application
Table 78: Demand in Germany from 2022 to 2034 – split by product
Table 79: Demand in Germany from 2022 to 2034 – split by construction segment
Table 80: Production, import, export, and demand in Germany from 2022 to 2034
Table 81: Production in Germany from 2022 to 2034 – split by product
Table 82: Revenues generated in Greece from 2022 to 2034, in million USD and million EUR
Table 83: Demand in Greece from 2022 to 2034 – split by product
Table 84: Demand in Greece from 2022 to 2034 – split by construction segment
Table 85: Production, import, export, and demand in Greece from 2022 to 2034
Table 86: Production in Greece from 2022 to 2034 – split by product
Table 87: Revenues generated in Hungary from 2022 to 2034, in million USD and million EUR
Table 88: Demand in Hungary from 2022 to 2034 – split by product
Table 89: Demand in Hungary from 2022 to 2034 – split by construction segment
Table 90: Production, import, export, and demand in Hungary from 2022 to 2034
Table 91: Production in Hungary from 2022 to 2034 – split by product
Table 92: Revenues generated in Italy from 2022 to 2034, in million USD and million EUR
Table 93: Revenues generated in Italy from 2022 to 2034 – split by application
Table 94: Demand in Italy from 2022 to 2034 – split by application
Table 95: Demand in Italy from 2022 to 2034 – split by product
Table 96: Demand in Italy from 2022 to 2034 – split by construction segment
Table 97: Production, import, export, and demand in Italy from 2022 to 2034
Table 98: Production in Italy from 2022 to 2034 – split by product
Table 99: Revenues generated in Norway from 2022 to 2034, in million USD and million EUR
Table 100: Demand in Norway from 2022 to 2034 – split by product
Table 101: Demand in Norway from 2022 to 2034 – split by construction segment
Table 102: Production, import, export, and demand in Norway from 2022 to 2034
Table 103: Production in Norway from 2022 to 2034 – split by product
Table 104: Revenues generated in Poland from 2022 to 2034, in million USD and million EUR
Table 105: Revenues generated in Poland from 2022 to 2034 – split by application
Table 106: Demand in Poland from 2022 to 2034 – split by application
Table 107: Demand in Poland from 2022 to 2034 – split by product
Table 108: Demand in Poland from 2022 to 2034 – split by construction segment
Table 109: Production, import, export, and demand in Poland from 2022 to 2034
Table 110: Production in Poland from 2022 to 2034 – split by product
Table 111: Revenues generated in Portugal from 2022 to 2034, in million USD and million EUR
Table 112: Demand in Portugal from 2022 to 2034 – split by product
Table 113: Demand in Portugal from 2022 to 2034 – split by construction segment
Table 114: Production, import, export, and demand in Portugal from 2022 to 2034
Table 115: Production in Portugal from 2022 to 2034 – split by product
Table 116: Revenues generated in Romania from 2022 to 2034, in million USD and million EUR
Table 117: Demand in Romania from 2022 to 2034 – split by product
Table 118: Demand in Romania from 2022 to 2034 – split by construction segment
Table 119: Production, import, export, and demand in Romania from 2022 to 2034
Table 120: Production in Romania from 2022 to 2034 – split by product
Table 121: Revenues generated in Russia from 2022 to 2034, in million USD and million EUR
Table 122: Revenues generated in Russia from 2022 to 2034 – split by application
Table123: Demand in Russia from 2022 to 2034 – split by application
Table124: Demand in Russia from 2022 to 2034 – split by product
Table125: Demand in Russia from 2022 to 2034 – split by construction segment
Table126: Production, import, export, and demand in Russia from 2022 to 2034
Table 127: Production in Russia from 2022 to 2034 – split by product
Table 128: Revenues generated in Serbia from 2022 to 2034, in million USD and million EUR
Table 129: Demand in Serbia from 2022 to 2034 – split by product
Table 130: Demand in Serbia from 2022 to 2034 – split by construction segment
Table 131: Production, import, export, and demand in Serbia from 2022 to 2034
Table 132: Production in Serbia from 2022 to 2034 – split by product
Table 133: Revenues generated in Slovakia from 2022 to 2034, in million USD and million EUR
Table 134: Demand in Slovakia from 2022 to 2034 – split by product
Table 135: Demand in Slovakia from 2022 to 2034 – split by construction segment
Table 136: Production, import, export, and demand in Slovakia from 2022 to 2034
Table 137: Production in Slovakia from 2022 to 2034 – split by product
Table 138: Revenues generated in Spain from 2022 to 2034, in million USD and million EUR
Table 139: Revenues generated in Spain from 2022 to 2034 – split by application
Table 140: Demand in Spain from 2022 to 2034 – split by application
Table 141: Demand in Spain from 2022 to 2034 – split by product
Table 142: Demand in Spain from 2022 to 2034 – split by construction segment
Table 143: Production, import, export, and demand in Spain from 2022 to 2034
Table 144: Production in Spain from 2022 to 2034 – split by product
Table 145: Revenues generated in Sweden from 2022 to 2034, in million USD and million EUR
Table 146: Demand in Sweden from 2022 to 2034 – split by product
Table 147: Demand in Sweden from 2022 to 2034 – split by construction segment
Table 148: Production, import, export, and demand in Sweden from 2022 to 2034
Table 149: Production in Sweden from 2022 to 2034 – split by product
Table 150: Revenues generated in Switzerland from 2022 to 2034, in million USD and million EUR
Table 151: Demand in Switzerland from 2022 to 2034 – split by product
Table 152: Demand in Switzerland from 2022 to 2034 – split by construction segment
Table 153: Production, import, export, and demand in Switzerland from 2022 to 2034
Table154: Production in Switzerland from 2022 to 2034 – split by product
Table 155: Revenues generated in the Netherlands from 2022 to 2034, in million USD and million EUR
Table 156: Demand in the Netherlands from 2022 to 2034 – split by product
Table 157: Demand in the Netherlands from 2022 to 2034 – split by construction segment
Table 158: Production, import, export, and demand in the Netherlands from 2022 to 2034
Table 159: Production in the Netherlands from 2022 to 2034 – split by product
Table 160: Revenues generated in Türkiye from 2022 to 2034, in million USD and million EUR
Table 161: Revenues generated in Türkiye from 2022 to 2034 – split by application
Table162: Demand in Türkiye from 2022 to 2034 – split by application
Table163: Demand in Türkiye from 2022 to 2034 – split by product
Table164: Demand in Türkiye from 2022 to 2034 – split by construction segment
Table165: Production, import, export, and demand in Türkiye from 2022 to 2034
Table166: Production in Türkiye from 2022 to 2034 – split by product
Table 167: Revenues generated in the United Kingdom from 2022 to 2034, in million USD and million EUR
Table 168: Revenues generated in the United Kingdom from 2022 to 2034 – split by application
Table 169: Demand in the United Kingdom from 2022 to 2034 – split by application
Table 170: Demand in the United Kingdom from 2022 to 2034 – split by product
Table 171: Demand in the United Kingdom from 2022 to 2034 – split by construction segment
Table 172: Production, import, export, and demand in the United Kingdom from 2022 to 2034
Table173: Production in the United Kingdom from 2022 to 2034 – split by product
Table 174: Revenues generated in the remaining countries of Europe from 2022 to 2034, in million USD and million EUR
Table 175: Demand in the remaining countries of Europe from 2022 to 2034 – split by product
Table 176: Demand in the remaining countries of Europe from 2022 to 2034 – split by construction segment
Table 177: Production, import, export, and demand in the remaining countries of Europe from 2022 to 2034
Table 178: Production in the remaining countries of Europe from 2022 to 2034 – split by product


