

Description
Are you interested in an updated edition? Then please indicate the desired publication date and content in the form. We look forward to responding to you promptly.
The Plastic Extrusion Market Report – Europe is now also available in parts (e.g. individual country profiles or all manufacturer profiles). Please feel free to contact us and we will immediately send you an offer for your specific selection.
Pipes, sheets, profiles and hoses in almost any length: next to injection molding, extrusion is the most important process in the plastics industry. In fact, more thermoplastics and elastomers are forced through molding dies at high pressure than are cast: Extruding and extrusion blow molding are used to process about 25 million tonnes of plastics per year in Europe. Ceresana has specifically examined the European market for extrusion plastics.
Soft Rubber, Rigid PVC
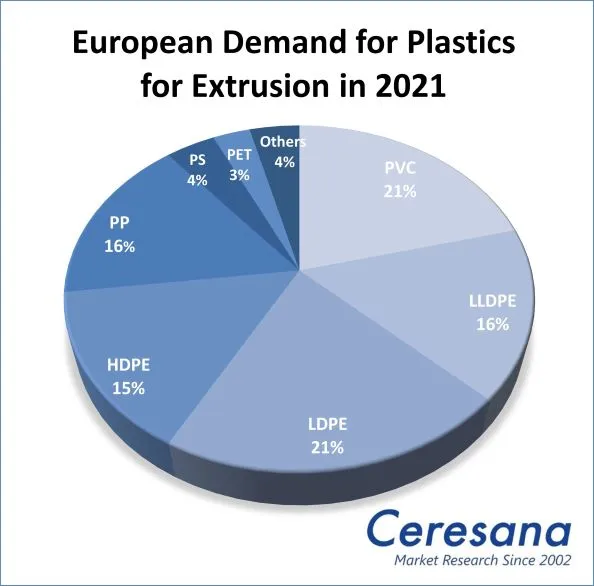
Extrusion was originally developed by the rubber industry. Today, the process is primarily used for thermoplastics, particularly for the plastic grade polyvinyl chloride (PVC). The second most important type of plastic for extrusion is polyethylene-LDPE with a market share of around 21%. The current study by Ceresana also provides market data on polyethylene-LLDPE and HDPE, polypropylene (PP), polystyrene (PS), polyethylene terephthalate (PET), and other plastic grades.
Tons of Thin Packaging Film
The most important sales market for extrusion products in Europe is the packaging industry, with over 12 million tonnes. Thin extruded plastic tubes are inflated and cut into films, bags, pouches and sacks of all kinds. Packaging films include a large part of the films used for food, but also films in the non-food sector, such as packaging for cosmetics, hygiene products, textiles or stationery. The market for packaging films is benefiting from a continuous trend towards flexible packaging solutions in many segments. In addition to weight and resource savings, this should also increase consumer convenience. The most important plastic grade in the packaging sector is polyethylene-LLDPE, followed by LDPE and polypropylene.
Extruded Window Frames and Door Seals
The second largest area of application for plastic extrusion is the construction industry. By far the most important type of plastic in this sector is polyvinyl chloride: In 2021, 3.7 million tonnes of PVC were used for this purpose in Europe. The most important plastic products in the construction industry are pipes and windows. In addition, many other construction elements are made of plastic: Floors, covers, facade parts, coatings, films, sheets, sealants, doors, as well as small parts and fasteners. However, the most dynamic development in demand for extrusion plastics is not expected to be in the construction sector, but in the automotive sector: Ceresana expects European demand in the “transportation” application area to increase by 1.7% per year until 2031.
Overview of the Study:
Chapter 1 provides a breakdown of the European plastics extrusion market – including forecasts up to 2031. Demand and revenues are explained for the countries in Western and Eastern Europe.
It also breaks down demand for each type of plastic:
- polyvinyl chloride (PVC)
- polyethylene – LDPE
- polyethylene – LLDPE
- polyethylene – HDPE
- polypropylene (PP)
- polystyrene (PS)
- polyethylene terephthalate (PET)
- other plastic types
Chapter 2 examines country-specific market data for 22 European countries, i.e. demand and revenues for extrusion plastics in each case.
Demand is examined in detail for individual product types and various application areas:
- Packaging
- Construction
- Transportation
- Electrical & Electronics (E&E)
- Industrial Products
- Others
Chapter 3 provides a useful directory of the 69 most important European companies in the plastics extrusion sector. It is clearly structured according to contact details, revenues, profit, product range, production sites and brief profile. The companies profiled include, for example, Aliaxis S.A., Amcor Ltd., Bolloré Divisions Films Plastiques, Covestro AG, Geberit AG, Georg Fischer AG, Huhtamäki Oyi, Mondi Group, Saudi Basic Industries Corp. (SABIC), Sealed Air Corporation, and Toray Industries, Inc.
Scope of the Report:
Attributes | Details |
| Base Year | 2021 |
| Trend Period | 2019 – 2031 |
| Forecast Period | 2022 – 2031 |
| Pages | 240 |
| Types of Plastics | Polyvinyl Chloride (PVC), Polyethylene – LDPE, Polyethylene – LLDPE, Polyethylene – HDPE, Polypropylene (PP), Polystyrene (PS), Polyethylene Terephthalate (PET), Other Plastic Types |
| Application Areas | Packaging, Construction, Transportation, Electrical and Electronics, Industrial Products, Other Applications |
| Company Profiles | Aliaxis S.A., Amcor Ltd., Bolloré Divisions Films Plastiques, Covestro AG, Geberit AG, Georg Fischer AG, Huhtamäki Oyi, Mondi Group, Saudi Basic Industries Corp. (SABIC), Sealed Air Corporation, and Toray Industries, Inc. (Selection) |
| Edition | 1st edition |
| Publication | December 2022 |
FAQs
How many tonnes of plastic are used for plastic extrusion each year?
Extruding and extrusion blow molding are used to process about 25 million tonnes of plastics per year in Europe.
Which plastic type is most commonly used for plastic extrusion?
Polyvinyl chloride (PVC) is the most commonly used plastic type for extrusion.
Which application area represents the most important sales market?
The most important sales market for extrusion products in Europe is the packaging industry, with over 12 million tonnes.
1 Market Data: Europe
1.1 Demand
1.2 Revenues
1.3 Demand Split by Application Areas
1.3.1 Packaging
1.3.2 Construction Industry
1.3.3 Transportation
1.3.4 Electrical and Electronics
1.3.5 Industrial Products
1.3.6 Other Applications
1.4 Demand Split by Products
1.4.1 Polyvinyl Chloride (PVC)
1.4.2 Polyethylene (LLDPE)
1.4.3 Polyethylene (LDPE)
1.4.4 Polyethylene (HDPE)
1.4.5 Polypropylene (PP)
1.4.6 Polystyrene (PS)
1.4.7 Polyethylene Terephthalate (PET)
1.4.8 Other Products
2 Market Data: Countries
(For each country: Revenues and demand per products and applications)
2.1 Austria
2.2 Belgium
2.3 Bulgaria
2.4 Czechia
2.5 Denmark
2.6 Finland
2.7 France
2.8 Germany
2.9 Greece
2.10 Hungary
2.11 Italy
2.12 Poland
2.13 Portugal
2.14 Romania
2.15 Russia
2.16 Slovakia
2.17 Spain
2.18 Sweden
2.19 Switzerland
2.20 The Netherlands
2.21 Turkey
2.22 United Kingdom
2.23 Rest of Europe
3 Company Profiles*
Austria (5 Producers)
Belgium (5)
Finland (4)
France (4)
Denmark (3)
Germany (16)
Italy (6)
Luxembourg (2)
Portugal (1)
Russia (2)
Spain (2)
Sweden (3)
Switzerland (6)
The Netherlands (2)
Turkey (1)
United Kingdom (7)
*Note: The profiles are assigned to the country in which the company or holding is headquartered. Profiles also include JVs and subsidiaries.
Graph 1: Demand in Europe from 2019 to 2031
Graph 2: Revenues generated in Europe from 2019 to 2031 in billion USD and billion EUR
Graph 3: Demand in Austria from 2019 until 2031
Graph 4: Demand in Belgium from 2019 to 2031
Graph 5: Demand in Bulgaria from 2019 to 2031
Graph 6: Demand in Czechia from 2019 to 2031
Graph 7: Demand in Denmark from 2019 to 2031
Graph 8: Demand in Finland from 2019 to 2031
Graph 9: Demand in France from 2019 to 2031
Graph 10: Demand in Germany from 2019 to 2031
Graph 11: Demand in Greece from 2019 to 2031
Graph 12: Demand in Hungary from 2019 to 2031
Graph 13: Demand in Italy from 2019 to 2031
Graph 14: Demand in Poland from 2019 to 2031
Graph 15: Demand in Portugal from 2019 to 2031
Graph 16: Demand in Romania from 2019 to 2031
Graph 17: Demand in Russia from 2019 to 2031
Graph 18: Demand in Slovakia from 2019 to 2031
Graph 19: Demand in Spain from 2019 to 2031
Graph 20: Demand in Sweden from 2019 to 2031
Graph 21: Demand in Switzerland from 2019 to 2031
Graph 22: Demand in the Netherlands from 2019 to 2031
Graph 23: Demand in Turkey from 2019 to 2031
Graph 24: Demand in the United Kingdom from 2019 to 2031
Graph 25: Demand in the remaining European countries from 2019 to 2031
Table 1: European demand from 2019 to 2031 – split by countries
Table 2: European demand from 2019 to 2031 – split by applications
Table 3: European demand in the segment packaging from 2019 to 2031 – split by countries
Table 4: European demand in the segment packaging from 2019 to 2031 – split by products
Table 5: European demand in the segment construction from 2019 to 2031 – split by countries
Table 6: European demand in the segment construction from 2019 to 2031 – split by products
Table 7: European demand in the segment transportation from 2019 to 2031 – split by countries
Table 8: European demand in the segment transportation from 2019 to 2031 – split by products
Table 9: European demand in the segment E&E from 2019 to 2031 – split by countries
Table 10: European demand in the segment E&E from 2019 to 2031 – split by products
Table 11: European demand in the segment industry from 2019 to 2031 – split by countries
Table 12: European demand in the segment industrial products from 2019 to 2031 – split by products
Table 13: European demand in other applications from 2019 to 2031 – split by countries
Table 14: European demand in other applications from 2019 to 2031 – split by products
Table 15: Demand in Europe from 2019 to 2031 – split by products
Table 16: European demand for PVC from 2019 to 2031 – split by countries
Table 17: European demand for LLDPE for extrusion from 2019 to 2031 – split by countries
Table 18: European demand for LDPE for extrusion from 2019 to 2031 – split by countries
Table 19: European demand for HDPE for extrusion from 2019 to 2031 – split by countries
Table 20: European demand for PP for extrusion from 2019 to 2031 – split by countries
Table 21: European demand for PS for extrusion from 2019 to 2031 – split by countries
Table 22: European demand for PET for extrusion from 2019 to 2031 – split by countries
Table 23: European demand for other plastics for extrusion from 2019 to 2031 – split by countries
Table 24: Revenues generated in Austria from 2019 to 2031 in billion USD and billion EUR
Table 25: Demand in Austria from 2019 to 2031 – split by applications
Table 26: Demand in Austria from 2019 to 2031 – split by products
Table 27: Revenues generated in Belgium from 2019 to 2031 in billion USD and billion EUR
Table 28: Demand in Belgium from 2019 to 2031 – split by applications
Table 29: Demand in Belgium from 2019 to 2031 – split by products
Table 30: Revenues generated in Bulgaria from 2019 to 2031 in billion USD and billion EUR
Table 31: Demand in Bulgaria from 2019 to 2031 – split by applications
Table 32: Demand in Bulgaria from 2019 to 2031 – split by products
Table 33: Revenues generated in Czechia from 2019 to 2031 in billion USD and billion EUR
Table 34: Demand in Czechia from 2019 to 2031 – split by applications
Table 35: Demand in Czechia from 2019 to 2031 – split by products
Table 36: Revenues generated in Denmark from 2019 to 2031 in billion USD and billion EUR
Table 37: Demand in Denmark from 2019 to 2031 – split by applications
Table 38: Demand in Denmark from 2019 to 2031 – split by products
Table 39: Revenues generated in Finland from 2019 to 2031 in billion USD and billion EUR
Table 40: Demand in Finland from 2019 to 2031 – split by applications
Table 41: Demand in Finland from 2019 to 2031 – split by products
Table 42: Revenues generated in France from 2019 to 2031, in million USD and million EUR
Table 43: Demand in France from 2019 to 2031 – split by applications
Table 44: Demand in France from 2019 to 2031 – split by products
Table 45: Revenues generated in Germany from 2019 to 2031 in billion USD and billion EUR
Table 46: Demand in Germany from 2019 to 2031 – split by applications
Table 47: Demand in Germany from 2019 to 2031 – split by products
Table 48: Revenues generated in Greece from 2019 to 2031 in billion USD and billion EUR
Table 49: Demand in Greece from 2019 to 2031 – split by applications
Table 50: Demand in Greece from 2019 to 2031 – split by products
Table 51: Revenues generated in Hungary from 2019 to 2031 in billion USD and billion EUR
Table 52: Demand in Hungary from 2019 to 2031 – split by applications
Table 53: Demand in Hungary from 2019 to 2031 – split by products
Table 54: Revenues generated in Italy from 2019 to 2031 in billion USD and billion EUR
Table 55: Demand in Italy from 2019 to 2031 – split by applications
Table 56: Demand in Italy from 2019 to 2031 – split by products
Table 57: Revenues generated in Poland from 2019 to 2031 in billion USD and billion EUR
Table 58: Demand in Poland from 2019 to 2031 – split by applications
Table 59: Demand in Poland from 2019 to 2031 – split by products
Table 60: Revenues generated in Portugal from 2019 to 2031 in billion USD and billion EUR
Table 61: Demand in Portugal from 2019 to 2031 – split by applications
Table 62: Demand in Portugal from 2019 to 2031 – split by products
Table 63: Revenues generated in Romania from 2019 to 2031 in billion USD and billion EUR
Table 64: Demand in Romania from 2019 to 2031 – split by applications
Table 65: Demand in Romania from 2019 to 2031 – split by products
Table 66: Revenues generated in Russia from 2019 to 2031 in billion USD and billion EUR
Table 67: Demand in Russia from 2019 to 2031 – split by applications
Table 68: Demand in Russia from 2019 to 2031 – split by products
Table 69: Revenues generated in Slovakia from 2019 to 2031, in billion USD and billion EUR
Table 70: Demand in Slovakia from 2019 to 2031 – split by applications
Table 71: Demand in Slovakia from 2019 to 2031 – split by products
Table 72: Revenues generated in Spain from 2019 to 2031 in billion USD and billion EUR
Table 73: Demand in Spain from 2019 to 2031 – split by applications
Table 74: Demand in Spain from 2019 to 2031 – split by products
Table 75: Revenues generated in Sweden from 2019 to 2031 in billion USD and billion EUR
Table 76: Demand in Sweden from 2019 to 2031 – split by applications
Table 77: Demand in Sweden from 2019 to 2031 – split by products
Table 78: Revenues generated in Switzerland from 2019 to 2031 in billion USD and billion EUR
Table 79: Demand in Switzerland from 2019 to 2031 – split by applications
Table 80: Demand in Switzerland from 2019 to 2031 – split by products
Table 81: Revenues generated in the Netherlands from 2019 to 2031, in billion USD and billion EUR
Table 82: Demand in the Netherlands from 2019 to 2031 – split by applications
Table 83: Demand in the Netherlands from 2019 to 2031 — split by products
Table 84: Revenues generated in Turkey from 2019 to 2031, in billion USD and billion EUR
Table 85: Demand in Turkey from 2019 to 2031 – split by applications
Table 86: Demand in Turkey from 2019 to 2031 – split by products
Table 87: Revenues generated in the United Kingdom from 2019 to 2031 in billion USD and billion EUR
Table 88: Demand in the United Kingdom from 2019 to 2031 – split by applications
Table 89: Demand in the United Kingdom from 2019 to 2031 – split by products
Table 90: Revenues in the remaining European countries from 2019 to 2031 in billion USD and billion EUR
Table 91: Demand in the remaining European countries from 2019 to 2031 – split by applications
Table 92: Demand in the remaining European countries from 2019 to 2031 – split by products


