

Description
The Market Report on Biobased Surfactants is now also available in parts (e.g. individual country profiles or all manufacturer profiles). Please feel free to contact us and we will immediately send you an offer for your specific selection.
Cleaning with the help of bacteria, fungi, or algae: Detergents and shampoos do not necessarily have to be made from climate-damaging crude oil or controversial palm oil. Surfactants can also be fermented by microorganisms from organic waste, for example. The latest, already second edition of Ceresana’s biobased surfactants market report forecasts that the global market for these green chemicals will experience sales growth to more than USD 32 billion by 2034. In North America, Ceresana’s market researchers expect sales to increase by around 3%, and in other regions of the world by more than 6%. Surfactants are among the first everyday chemical products that are already being manufactured in large industrial plants from renewable raw materials, i.e. at least partly on the basis of biogenic materials such as sugar, corn, or vegetable oil.
Clean Bioeconomy
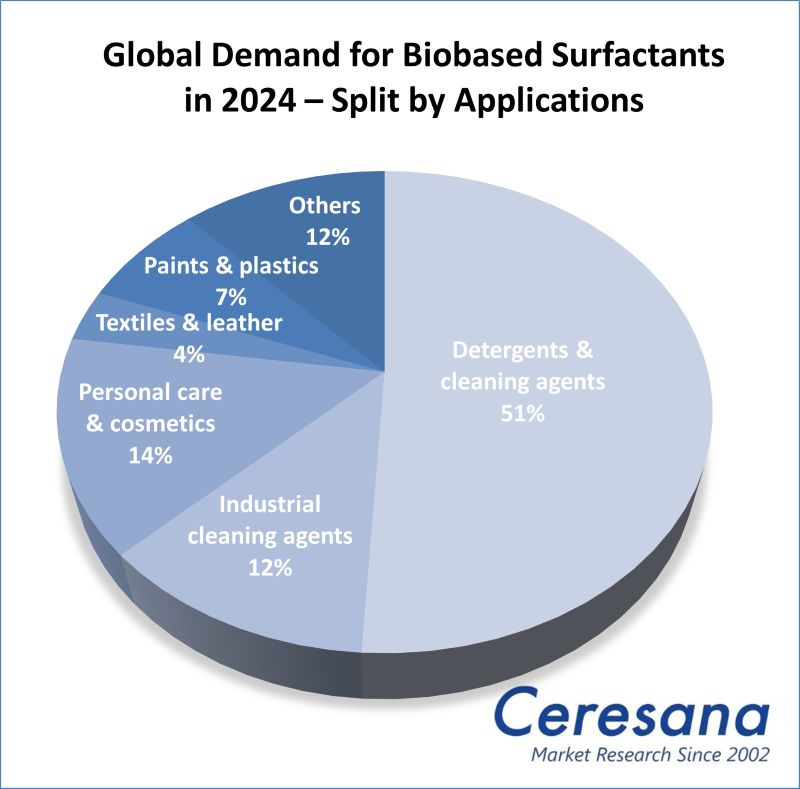
Washing powders and liquid detergents consist to a large extent of surfactants, as these surface-active substances make it easier to remove dirt. In addition, surfactants can form a foam and enable the mixture of water and oil. Household detergents and natural cleaning products are by far the most important sales market for bio-based surfactants today, accounting for around 43% of global revenues. This is followed by personal care products and cosmetics as well as industrial cleaning agents. The versatile chemicals are used for a wide variety of applications, for example as emulsifiers in skin creams, as dispersing agents in paints and printing inks, as antistatic additives in plastics and textile fibers or as wetting agents in fertilizers and pesticides. There are surfactants in toothpaste as well as in cooling lubricants, extinguishing foam, disinfectants and contraceptives. One industrial application, for example, is ore extraction. Even companies in the oil industry can use biosurfactants to improve their eco-balance, for example in oilfield chemicals or for the bioremediation of contaminated areas.
Sustainable Upcycling of Biomass
Bio-based surfactants not only reduce dependence on fossil raw materials, but also open up new recycling opportunities for organic residues, such as by-products from the paper industry and biofuel production or food waste from supermarkets. All surfactants have a water-repellent and a water-attracting part, both of which can be bio-based. Sugar surfactants can consist of coconut fatty alcohols and glucose, for example. The most important sugar surfactants at present are the high-foaming alkyl polyglycosides (APGs): non-ionic surfactants that can be produced purely on a plant basis. APGs are less sensitive to water hardness than anionic surfactants, effective at lower temperatures, skin-friendly, non-toxic, and biodegradable. With these environmentally friendly properties, APGs could become an alternative to linear alkylbenzene sulfates (LAS), the most widely used petrochemical surfactants today. Glycolipids are also considered a promising class of substances: These natural building blocks of cell membranes were one of the main topics of the international conference “Biosurfactants 2025” in Aachen, Germany. Surfactants are also often mixed with other chemicals, for example with complexing agents in detergents, which are ideally also available as organic versions. Blends of petrochemical and biogenic chemicals are marketed as “bioattributed”, “proportionately biobased”, or “mass-balanced grades”.
Current Global Biobased Surfactants Market Report (2nd Edition):
Chapter 1 of the new study by Ceresana provides a comprehensive analysis of the global biobased surfactants market – including growth forecasts up to 2034: The development of demand (in tonnes) and revenues (in USD and EUR) is explained for each of the following regions: Western and Eastern Europe, North and South America, Asia-Pacific, the Middle East, and Africa. Demand and revenues are also broken down by individual application areas.
Demand for bio-based surfactants is recorded for these product types:
- Anionic surfactants
- Cationic surfactants
- Non-ionic surfactants
- Other surfactants
In Chapter 2, the surfactant sales for 26 countries are analyzed individually, i.e. for the largest national surfactant markets: France, Germany, Italy, Spain, the United Kingdom, Poland, Russia, Türkiye, Canada, Mexico, the USA, Argentina, Brazil, China, India, Indonesia, Japan, South Korea, Taiwan, Thailand, Iran, Pakistan, Saudi Arabia, Egypt, Nigeria, and South Africa. The demand for and revenues generated with bio-based surfactants are shown in each case.
In addition, demand is split by the aforementioned product types and demand and revenues are broken down for the following applications:
- Detergents and cleaners
- Industrial cleaners
- Personal care and cosmetics
- Textiles and leather
- Paints and plastics
- Other applications
Chapter 3 provides useful company profiles of the largest bio-based surfactant manufacturers, clearly arranged according to contact details, revenues, net income, product range, production sites, and short overview of the company. Detailed profiles of the most important 55 manufacturers are provided, e.g. of Arkema S.A., BASF SE, Evonik Industries AG, Givaudan SA, KLK OLEO, Nouryon Specialty Chemicals B.V., Sasol Limited, The Dow Chemical Company, and Wilmar International Limited.
=> A current market report on the entire global surfactants market is available from Ceresana: The market study “Surfactants – World (4th edition)” also covers products that are not bio-based. In addition, Ceresana regularly examines the markets for various surfactant applications: Printing inks, paints and coatings, and plastics. Ceresana has also published new market studies on various packaging materials. A particular focus of Ceresana’s market research is on bio-based products. Ceresana also organizes online events on the bio-economy, for example on bioplastics and bio-based packaging.
Scope of the Report:
Attributes | Details |
Base Year | 2024 |
Trend Period | 2022 – 2034 |
Forecast Period | 2025 – 2034 |
Pages | 300 |
Product Types | Anionic surfactants, cationic surfactants, non-ionic surfactants, and other surfactants |
Application Areas | Detergents and cleaning agents, industrial cleaning agents, personal care and cosmetics, textiles and leather, paints and plastics, and other applications |
Company Profiles | Arkema, BASF, Evonik, Givaudan, Nouryon, Sasol, Dow, and Wilmar (Selection) |
Edition | 2nd edition |
Publication | December 2025 |
FAQs
What are biobased surfactants?
Surfactants are among the first everyday chemical products that are already being manufactured in large industrial plants from renewable raw materials, i.e. at least partly on the basis of biogenic materials such as sugar, corn, or vegetable oil.
How will sales of biobased surfactants develop by 2034?
In North America, Ceresana’s market researchers expect sales to increase by around 3%, and in other regions of the world by more than 6% – to more than USD 32 billion by 2034
What are the most important applications for bio-based surfactants?
The largest market for organic surfactants is household detergents and cleaning agents, which currently account for around 43 percent of global sales. This is followed by personal care products, cosmetics, and industrial cleaning agents.
Are there alternatives to petrochemical LAS surfactants?
Alkyl polyglycosides (APGs), currently the most important sugar surfactants, can be produced entirely from plant-based sources. They are considered to be more environmentally friendly and healthier than LAS.
1 Market Data: World and Regions
1.1 World
1.1.1 Basics
1.1.2 Demand
1.1.3 Revenues
1.1.4 Demand Split by Application Area
1.1.4.1 Detergents & Cleaners
1.1.4.2 Industrial Cleaners
1.1.4.3 Personal Care & Cosmetics
1.1.4.4 Textiles & Leather
1.1.4.5 Paints & Plastics
1.1.4.6 Other Applications
1.1.5 Revenues Split by Application Area
1.1.5.1 Detergents & Cleaners
1.1.5.2 Industrial Cleaners
1.1.5.3 Personal Care & Cosmetics
1.1.5.4 Textiles & Leather
1.1.5.5 Paints & Plastics
1.1.5.6 Other Applications
1.1.6 Demand Split by Product
1.1.6.1 Anionic Surfactants
1.1.6.2 Cationic Surfactants
1.1.6.3 Non-Ionic Surfactants
1.1.6.4 Other Surfactants
1.2 Western Europe
1.2.1 Demand
1.2.2 Revenues
1.2.3 Applications and Products
1.3 Eastern Europe
1.3.1 Demand
1.3.2 Revenues
1.3.3 Applications and Products
1.4 North America
1.4.1 Demand
1.4.2 Revenues
1.4.3 Applications and Products
1.5 South America
1.5.1 Demand
1.5.2 Revenues
1.5.3 Applications and Products
1.6 Asia-Pacific
1.6.1 Demand
1.6.2 Revenues
1.6.3 Applications and Products
1.7 Middle East
1.7.1 Demand
1.7.2 Revenues
1.7.3 Applications and Products
1.8 Africa
1.8.1 Demand
1.8.2 Revenues
1.8.3 Applications and Products
2 Market Data: Countries
2.1 Western Europe
2.1.1 France
2.1.2 Germany
2.1.3 Italy
2.1.4 Spain
2.1.5 United Kingdom
2.1.6 Other Western Europe
2.2 Eastern Europe
2.2.1 Poland
2.2.2 Russia
2.2.3 Türkiye
2.2.4 Other Eastern Europe
2.3 North America
2.3.1 Canada
2.3.2 Mexico
2.3.3 USA
2.4 South America
2.4.1 Argentina
2.4.2 Brazil
2.4.3 Other South America
2.5 Asia-Pacific
2.5.1 China
2.5.2 India
2.5.3 Indonesia
2.5.4 Japan
2.5.5 South Korea
2.5.6 Taiwan
2.5.7 Thailand
2.5.8 Other Asia-Pacific
2.6 Middle East
2.6.1 Iran
2.6.2 Pakistan
2.6.3 Saudi Arabia
2.6.4 Other Middle East
2.7 Africa
2.7.1 Egypt
2.7.2 Nigeria
2.7.3 South Africa
2.7.4 Other Africa
3 Company Profiles*
3.1 Western Europe
Belgium (3 producers)
Denmark (1)
France (3)
Germany (4)
Italy (2)
Norway (1)
Spain (1)
Switzerland (2)
The Netherlands (1)
United Kingdom (2)
3.2 Eastern Europe
Czechia (1)
Poland (1)
3.3 North America
USA (13)
3.4 Asia-Pacific
China (4)
India (4)
Japan (5)
Malaysia (1)
Singapore (3)
South Korea (1)
Thailand (1)
3.5 Africa
South Africa (1)
*Note: The profiles are assigned to the country in which the company or holding is headquartered. Profiles also include JVs and subsidiaries.
Graph 1: Global demand from 2022 to 2034
Graph 2: Global demand from 2022 to 2034 – split by region
Graph 3: Global revenues from 2022 to 2034 in billion USD and billion EUR
Graph 4: Global revenues from 2022 to 2034 in billion USD – split by region
Graph 5: Global revenues from 2022 to 2034 in billion EUR – split by region
Graph 6: Global demand from 2022 to 2034 – split by application
Graph 7: Global demand in the “detergents & cleaners” segment from 2022 to 2034 – split by region
Graph 8: Global demand in the “industrial cleaners” segment from 2022 to 2034 – split by region
Graph 9: Global demand in the “personal care & cosmetics” segment from 2022 to 2034 – split by region
Graph 10: Global demand in the “textiles & leather” segment from 2022 to 2034 – split by region
Graph 11: Global demand in the “paints & plastics” segment from 2022 to 2034 – split by region
Graph 12: Global demand in the “other applications” segment from 2022 to 2034 – split by region
Graph 13: Global demand from 2022 to 2034 – split by product
Graph 14: Global demand for “biobased anionic surfactants” from 2022 to 2034 – split by region
Graph 15: Global demand for “biobased cationic surfactants” from 2022 to 2034 – split by region
Graph 16: Global demand for “biobased non-ionic surfactants” from 2022 to 2034 – split by region
Graph 17: Global demand for “other biobased surfactants” from 2022 to 2034 – split by region
Graph 18: Demand in Western Europe from 2022 to 2034
Graph 19: Revenues generated in Western Europe from 2022 to 2034 in billion USD and billion EUR
Graph 20: Demand in Western Europe from 2022 to 2034 – split by application
Graph 21: Demand in Eastern Europe from 2022 to 2034
Graph 22: Revenues generated in Eastern Europe from 2022 to 2034, in billion USD and billion EUR
Graph 23: Demand in Eastern Europe from 2022 to 2034 – split by application
Graph 24: Demand in North America from 2022 to 2034
Graph 25: Revenues generated in North America from 2022 to 2034, in billion USD and billion EUR
Graph 26: Demand in North America from 2022 to 2034 – split by application
Graph 27: Demand in South America from 2022 to 2034
Graph 28: Revenues generated in South America from 2022 to 2034, in billion USD and billion EUR
Graph 29: Demand in South America from 2022 to 2034 – split by application
Graph 30: Demand in Asia-Pacific from 2022 to 2034
Graph 31: Revenues generated in Asia-Pacific from 2022 to 2034, in billion USD and billion EUR
Graph 32: Demand in Asia-Pacific from 2022 to 2034 – split by application
Graph 33: Demand in the Middle East from 2022 to 2034
Graph 34: Revenues generated in the Middle East from 2022 to 2034, in billion USD and billion EUR
Graph 35: Demand in the Middle East from 2022 to 2034 – split by application
Graph 36: Demand in Africa from 2022 to 2034
Graph 37: Revenues generated in Africa from 2022 to 2034, in billion USD and billion EUR
Graph 38: Demand in Africa from 2022 to 2034 – split by application
Graph 39: Demand in France from 2022 to 2034
Graph 40: Demand in Germany from 2022 to 2034
Graph 41: Demand in Italy from 2022 to 2034
Graph 42: Demand in Spain from 2022 to 2034
Graph 43: Demand in the United Kingdom from 2022 to 2034
Graph 44: Demand in Other Western Europe from 2022 to 2034
Graph 45: Demand in Poland from 2022 to 2034
Graph 46: Demand in Russia from 2022 to 2034
Graph 47: Demand in Türkiye from 2022 to 2034
Graph 48: Demand in Other Eastern Europe from 2022 to 2034
Graph 49: Demand in Canada from 2022 to 2034
Graph 50: Demand in Mexico from 2022 to 2034
Graph 51: Demand in the USA from 2022 to 2034
Graph 52: Demand in Argentina from 2022 to 2034
Graph 53: Demand in Brazil from 2022 to 2034
Graph 54: Demand in Other South America from 2022 to 2034
Graph 55: Demand in China from 2022 to 2034
Graph 56: Demand in India from 2022 to 2034
Graph 57: Demand in Indonesia from 2022 to 2034
Graph 58: Demand in Japan from 2022 to 2034
Graph 59: Demand in South Korea from 2022 to 2034
Graph 60: Demand in Taiwan from 2022 to 2034
Graph 61: Demand in Thailand from 2022 to 2034
Graph 62: Demand in Other Asia-Pacific from 2022 to 2034
Graph 63: Demand in Iran from 2022 to 2034
Graph 64: Demand in Pakistan from 2022 to 2034
Graph 65: Demand in Saudi Arabia from 2022 to 2034
Graph 66: Demand in Other Middle East from 2022 to 2034
Graph 67: Demand in Egypt from 2022 to 2034
Graph 68: Demand in Nigeria from 2022 to 2034
Graph 69: Demand in South Africa from 2022 to 2034
Graph 70: Demand in Other Africa from 2022 to 2034
Table 1: Global demand from 2022 to 2034 – split by region
Table 2: Global revenues from 2022 to 2034 in million USD – split by region
Table 3: Global revenues from 2022 to 2034 in million EUR – split by region
Table 4: Global demand from 2022 to 2034 – split by application
Table 5: Global demand in the “detergents & cleaners” segment from 2022 to 2034 – split by region
Table 6: Global demand in the “industrial cleaners” segment from 2022 to 2034 – split by region
Table 7: Global demand in the “personal care & cosmetics” segment from 2022 to 2034 – split by region
Table 8: Global demand in the “textiles & leather” segment from 2022 to 2034 – split by region
Table 9: Global demand in the “paints & plastics” segment from 2022 to 2034 – split by region
Table 10: Global demand in the “other applications” segment from 2022 to 2034 – split by region
Table 11: Global revenues from 2022 to 2034 – split by application
Table 12: Global revenues generated in the “detergents & cleaners” segment from 2022 to 2034 – split by region
Table 13: Global revenues generated in the “industrial cleaners” segment from 2022 to 2034 – split by region
Table 14: Global revenues generated in the “personal care & cosmetics” segment from 2022 to 2034 – split by region
Table 15: Global revenues generated in the “textiles & leather” segment from 2022 to 2034 – split by region
Table 16: Global revenues generated in the “paints & plastics” segment from 2022 to 2034 – split by region
Table 17: Global revenues generated in the “other applications” segment from 2022 to 2034 – split by region
Table 18: Global demand from 2022 to 2034 – split by product
Table 19: Global demand for “biobased anionic surfactants” from 2022 to 2034 – split by region
Table 20: Global demand for “biobased cationic surfactants” from 2022 to 2034 – split by region
Table 21: Global demand for “biobased non-ionic surfactants” from 2022 to 2034 – split by region
Table 22: Global demand for “other biobased surfactants” from 2022 to 2034 – split by region
Table 23: Demand in Western Europe from 2022 to 2034 – split by major country
Table 24: Revenues generated in Western Europe from 2022 to 2034, in million USD and million EUR
Table 25: Revenues generated in Western Europe from 2022 to 2034 – split by application
Table 26: Demand in Western Europe from 2022 to 2034 – split by application
Table 27: Demand in Western Europe from 2022 to 2034 – split by product
Table 28: Demand in Eastern Europe from 2022 to 2034 – split by major country
Table 29: Revenues generated in Eastern Europe from 2022 to 2034, in million USD and million EUR
Table 30: Revenues generated in Eastern Europe from 2022 to 2034 – split by application
Table 31: Demand in Eastern Europe from 2022 to 2034 – split by application
Table 32: Demand in Eastern Europe from 2022 to 2034 – split by product
Table 33: Demand in North America from 2022 to 2034 – split by major country
Table 34: Revenues generated in North America from 2022 to 2034, in million USD and million EUR
Table 35: Revenues generated in North America from 2022 to 2034 – split by application
Table 36: Demand in North America from 2022 to 2034 – split by application
Table 37: Demand in North America from 2022 to 2034 – split by product
Table 38: Demand in South America from 2022 to 2034 – split by major country
Table 39: Revenues generated in South America from 2022 to 2034, in million USD and million EUR
Table 40: Revenues generated in South America from 2022 to 2034 – split by application
Table 41: Demand in South America from 2022 to 2034 – split by application
Table 42: Demand in South America from 2022 to 2034 – split by product
Table 43: Demand in Asia-Pacific from 2022 to 2034 – split by major country
Table 44: Revenues generated in Asia-Pacific from 2022 to 2034, in million USD and million EUR
Table 45: Revenues generated in Asia-Pacific from 2022 to 2034 – split by application
Table 46: Demand in Asia-Pacific from 2022 to 2034 – split by application
Table 47: Demand in Asia-Pacific from 2022 to 2034 – split by product
Table 48: Demand in the Middle East from 2022 to 2034 – split by major country
Table 49: Revenues generated in the Middle East from 2022 to 2034, in million USD and million EUR
Table 50: Revenues generated in the Middle East from 2022 to 2034 – split by application
Table 51: Demand in the Middle East from 2022 to 2034 – split by application
Table 52: Demand in the Middle East from 2022 to 2034 – split by product
Table 53: Demand in Africa from 2022 to 2034 – split by major country
Table 54: Revenues generated in Africa from 2022 to 2034, in million USD and million EUR
Table 55: Revenues generated in Africa from 2022 to 2034 – split by application
Table 56: Demand in Africa from 2022 to 2034 – split by application
Table 57: Demand in Africa from 2022 to 2034 – split by product
Table 58: Revenues generated in France from 2022 to 2034, in million USD and million EUR
Table 59: Revenues generated in France from 2022 to 2034 – split by application
Table 60: Demand in France from 2022 to 2034 – split by application
Table 61: Demand in France from 2022 to 2034 – split by product
Table 62: Revenues generated in Germany from 2022 to 2034, in million USD and million EUR
Table 63: Revenues generated in Germany from 2022 to 2034 – split by application
Table 64: Demand in Germany from 2022 to 2034 – split by application
Table 65: Demand in Germany from 2022 to 2034 – split by product
Table 66: Revenues generated in Italy from 2022 to 2034, in million USD and million EUR
Table 67: Revenues generated in Italy from 2022 to 2034 – split by application
Table 68: Demand in Italy from 2022 to 2034 – split by application
Table 69: Demand in Italy from 2022 to 2034 – split by product
Table 70: Revenues generated in Spain from 2022 to 2034, in million USD and million EUR
Table 71: Revenues generated in Spain from 2022 to 2034 – split by application
Table 72: Demand in Spain from 2022 to 2034 – split by application
Table 73: Demand in Spain from 2022 to 2034 – split by product
Table 74: Revenues generated in the United Kingdom from 2022 to 2034, in million USD and million EUR
Table 75: Revenues generated in the United Kingdom from 2022 to 2034 – split by application
Table 76: Demand in the United Kingdom from 2022 to 2034 – split by application
Table 77: Demand in the United Kingdom from 2022 to 2034 – split by product
Table 78: Revenues generated in Other Western Europe from 2022 to 2034, in million USD and million EUR
Table 79: Revenues generated in Other Western Europe from 2022 to 2034 – split by application
Table 80: Demand in Other Western Europe from 2022 to 2034 – split by application
Table 81: Demand in Other Western Europe from 2022 to 2034 – split by product
Table 82: Revenues generated in Poland from 2022 to 2034, in million USD and million EUR
Table 83: Revenues generated in Poland from 2022 to 2034 – split by application
Table 84: Demand in Poland from 2022 to 2034 – split by application
Table 85: Demand in Poland from 2022 to 2034 – split by product
Table 86: Revenues generated in Russia from 2022 to 2034, in million USD and million EUR
Table 87: Revenues generated in Russia from 2022 to 2034 – split by application
Table 88: Demand in Russia from 2022 to 2034 – split by application
Table 89: Demand in Russia from 2022 to 2034 – split by product
Table 90: Revenues generated in Türkiye from 2022 to 2034, in million USD and million EUR
Table 91: Revenues generated in Türkiye from 2022 to 2034 – split by application
Table 92: Demand in Türkiye from 2022 to 2034 – split by application
Table 93: Demand in Türkiye from 2022 to 2034 – split by product
Table 94: Revenues generated in Other Eastern Europe from 2022 to 2034, in million USD and million EUR
Table 95: Revenues generated in Other Eastern Europe from 2022 to 2034 – split by application
Table 96: Demand in Other Eastern Europe from 2022 to 2034 – split by application
Table 97: Demand in Other Eastern Europe from 2022 to 2034 – split by product
Table 98: Revenues generated in Canada from 2022 to 2034, in million USD and million EUR
Table 99: Revenues generated in Canada from 2022 to 2034 – split by application
Table 100: Demand in Canada from 2022 to 2034 – split by application
Table 101: Demand in Canada from 2022 to 2034 – split by product
Table 102: Revenues generated in Mexico from 2022 to 2034, in million USD and million EUR
Table 103: Revenues generated in Mexico from 2022 to 2034 – split by application
Table 104: Demand in Mexico from 2022 to 2034 – split by application
Table 105: Demand in Mexico from 2022 to 2034 – split by product
Table 106: Revenues generated in the USA from 2022 to 2034, in million USD and million EUR
Table 107: Revenues generated in the USA from 2022 to 2034 – split by application
Table 108: Demand in the USA from 2022 to 2034 – split by application
Table 109: Demand in the USA from 2022 to 2034 – split by product
Table 110: Revenues generated in Argentina from 2022 to 2034, in million USD and million EUR
Table 111: Revenues generated in Argentina from 2022 to 2034 – split by application
Table 112: Demand in Argentina from 2022 to 2034 – split by application
Table 113: Demand in Argentina from 2022 to 2034 – split by product
Table 114: Revenues generated in Brazil from 2022 to 2034, in million USD and million EUR
Table 115: Revenues generated in Brazil from 2022 to 2034 – split by application
Table 116: Demand in Brazil from 2022 to 2034 – split by application
Table 117: Demand in Brazil from 2022 to 2034 – split by product
Table 118: Revenues generated in Other South America from 2022 to 2034, in million USD and million EUR
Table 119: Revenues generated in Other South America from 2022 to 2034 – split by application
Table 120: Demand in Other South America from 2022 to 2034 – split by application
Table 121: Demand in Other South America from 2022 to 2034 – split by product
Table 122: Revenues generated in China from 2022 to 2034, in million USD and million EUR
Table 123: Revenues generated in China from 2022 to 2034 – split by application
Table 124: Demand in China from 2022 to 2034 – split by application
Table 125: Demand in China from 2022 to 2034 – split by product
Table 126: Revenues generated in India from 2022 to 2034, in million USD and million EUR
Table 127: Revenues generated in India from 2022 to 2034 – split by application
Table 128: Demand in India from 2022 to 2034 – split by application
Table 129: Demand in India from 2022 to 2034 – split by product
Table 130: Revenues generated in Indonesia from 2022 to 2034, in million USD and million EUR
Table 131: Revenues generated in Indonesia from 2022 to 2034 – split by application
Table 132: Demand in Indonesia from 2022 to 2034 – split by application
Table 133: Demand in Indonesia from 2022 to 2034 – split by product
Table 134: Revenues generated in Japan from 2022 to 2034, in million USD and million EUR
Table 135: Revenues generated in Japan from 2022 to 2034 – split by application
Table 136: Demand in Japan from 2022 to 2034 – split by application
Table 137: Demand in Japan from 2022 to 2034 – split by product
Table 138: Revenues generated in South Korea from 2022 to 2034, in million USD and million EUR
Table 139: Revenues generated in South Korea from 2022 to 2034 – split by application
Table 140: Demand in South Korea from 2022 to 2034 – split by application
Table 141: Demand in South Korea from 2022 to 2034 – split by product
Table 142: Revenues generated in Taiwan from 2022 to 2034, in million USD and million EUR
Table 143: Revenues generated in Taiwan from 2022 to 2034 – split by application
Table 144: Demand in Taiwan from 2022 to 2034 – split by application
Table 145: Demand in Taiwan from 2022 to 2034 – split by product
Table 146: Revenues generated in Thailand from 2022 to 2034, in million USD and million EUR
Table 147: Revenues generated in Thailand from 2022 to 2034 – split by application
Table 148: Demand in Thailand from 2022 to 2034 – split by application
Table 149: Demand in Thailand from 2022 to 2034 – split by product
Table 150: Revenues generated in Other Asia-Pacific from 2022 to 2034, in million USD and million EUR
Table 151: Revenues generated in Other Asia-Pacific from 2022 to 2034 – split by application
Table 152: Demand in Other Asia-Pacific from 2022 to 2034 – split by application
Table 153: Demand in Other Asia-Pacific from 2022 to 2034 – split by product
Table 154: Revenues generated in Iran from 2022 to 2034, in million USD and million EUR
Table 155: Revenues generated in Iran from 2022 to 2034 – split by application
Table 156: Demand in Iran from 2022 to 2034 – split by application
Table 157: Demand in Iran from 2022 to 2034 – split by product
Table 158: Revenues generated in Pakistan from 2022 to 2034, in million USD and million EUR
Table 159: Revenues generated in Pakistan from 2022 to 2034 – split by application
Table 160: Demand in Pakistan from 2022 to 2034 – split by application
Table 161: Demand in Pakistan from 2022 to 2034 – split by product
Table 162: Revenues generated in Saudi Arabia from 2022 to 2034, in million USD and million EUR
Table 163: Revenues generated in Saudi Arabia from 2022 to 2034 – split by application
Table 164: Demand in Saudi Arabia from 2022 to 2034 – split by application
Table 165: Demand in Saudi Arabia from 2022 to 2034 – split by product
Table 166: Revenues generated in Other Middle East from 2022 to 2034, in million USD and million EUR
Table 167: Revenues generated in Other Middle East from 2022 to 2034 – split by application
Table 168: Demand in Other Middle East from 2022 to 2034 – split by application
Table 169: Demand in Other Middle East from 2022 to 2034 – split by product
Table 170: Revenues generated in Egypt from 2022 to 2034, in million USD and million EUR
Table 171: Revenues generated in Egypt from 2022 to 2034 – split by application
Table 172: Demand in Egypt from 2022 to 2034 – split by application
Table 173: Demand in Egypt from 2022 to 2034 – split by product
Table 174: Revenues generated in Nigeria from 2022 to 2034, in million USD and million EUR
Table 175: Revenues generated in Nigeria from 2022 to 2034 – split by application
Table 176: Demand in Nigeria from 2022 to 2034 – split by application
Table 177: Demand in Nigeria from 2022 to 2034 – split by product
Table 178: Revenues generated in South Africa from 2022 to 2034, in million USD and million EUR
Table 179: Revenues generated in South Africa from 2022 to 2034 – split by application
Table 180: Demand in South Africa from 2022 to 2034 – split by application
Table 181: Demand in South Africa from 2022 to 2034 – split by product
Table 182: Revenues generated in Other Africa from 2022 to 2034, in million USD and million EUR
Table 183: Revenues generated in Other Africa from 2022 to 2034 – split by application
Table 184: Demand in Other Africa from 2022 to 2034 – split by application
Table 185: Demand in Other Africa from 2022 to 2034 – split by product


