

Description
The Market Report on Biobased Surfactants is now also available in parts (e.g. individual country profiles or all manufacturer profiles). Please feel free to contact us and we will immediately send you an offer for your specific selection.
Green chemistry is becoming more and more important for the chemical industry: The packaging of cosmetics and cleaning products increasingly promises ingredients that are “100% organic, vegan, biodegradable, and renewable”. Glycolipids, for example, can be obtained from corn sugar or rapeseed oil. Ceresana has now analyzed the European bio-based surfactants market for the first time. Surfactants are among the first everyday chemical products that are already being produced in large quantities from renewable raw materials. Ceresana’s market researchers expect these “green” chemicals to generate sales of more than EUR 10.1 billion in Europe by 2034.
Clean Surfactants for Clean Water
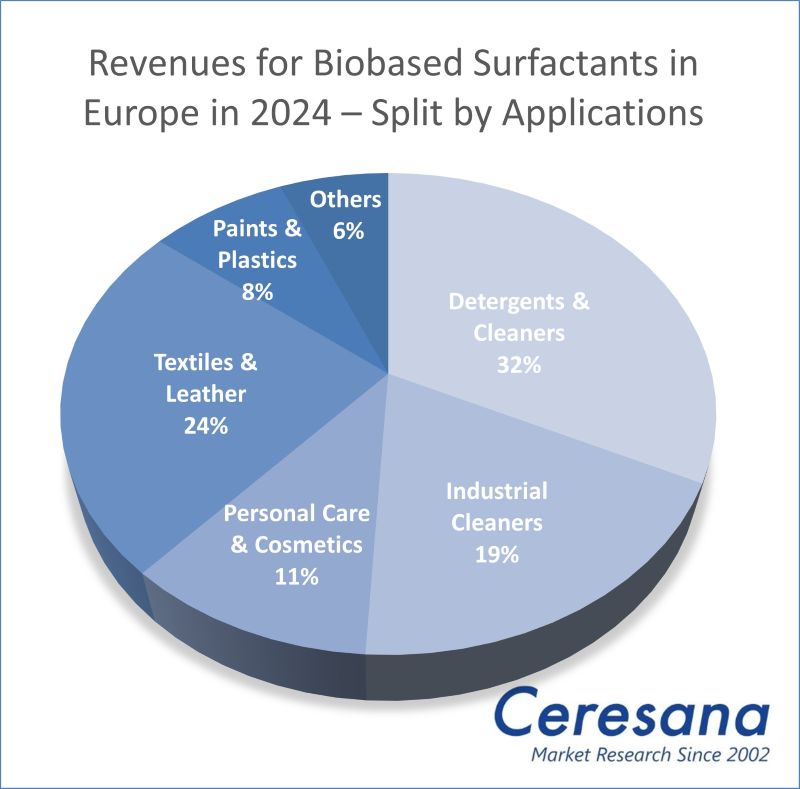
Natural surfactants may be more compatible with aquatic life and human skin than conventional fossil-based products. Surfactants or surface-active agents can facilitate the removal of dirt, form foam, and enable the mixing of water and oil. Because of this, they are the main ingredient in washing powder and liquid detergents. Household laundry detergents and natural cleaning products are by far the most important sales market for biosurfactants in Europe today, accounting for around 46% of total revenues. This is followed by personal care products and cosmetics as well as industrial cleaning agents. However, the versatile chemicals are also used for a wide variety of other applications, for example as emulsifiers in skin creams, as dispersing agents in paints and printing inks, as antistatic additives in plastics and textile fibers or as wetting agents in fertilizers and pesticides. There are surfactants in toothpaste as well as in cooling lubricants, extinguishing foam, disinfectants, and contraceptives. Industrial applications include ore extraction and the bioremediation of oil fields.
Bio-Economy with Biomass
All surfactants have a water-repellent and a water-attracting part, both of which can be bio-based. Sugar surfactants can consist of coconut fatty alcohols and glucose, for example. The most important sugar surfactants at present are the high-foaming alkyl polyglycosides (APGs): non-ionic surfactants that can be produced purely on a plant basis. APGs are less sensitive to water hardness than anionic surfactants, effective at lower temperatures, skin-friendly, non-toxic, and biodegradable. With these environmentally friendly properties, APGs could become an alternative to linear alkylbenzene sulfates (LAS), the most widely used petrochemical surfactants today. Glycolipids, such as sophorolipids and rhamnolipids, are also promising biochemicals. For many applications, surfactants are mixed with other chemicals, for example with complexing agents in detergents, which are ideally also available as organic versions. Blends of petrochemical and biogenic chemicals are marketed as “bioattributed”, “proportionately biobased”, or “mass-balanced grades”. The ongoing trend toward bio-based products not only reduces dependence on crude oil and natural gas, but also opens up new recycling opportunities for organic residues, such as by-products from the paper industry and biofuel production or food waste from supermarkets.
The First European Bio-Based Surfactants Market Report:
Chapter 1 of the new study by Ceresana provides a comprehensive analysis of the European biosurfactants market – including growth forecasts up to 2034. The market report shows the development of demand (in tonnes) and revenues (in USD and EUR). Demand and revenues are also broken down by individual application areas.
Demand for bio-based surfactants is recorded for these product types:
- Anionic surfactants
- Cationic surfactants
- Non-ionic surfactants
- Other surfactants
In Chapter 2, the surfactant sales for 18 countries are analyzed individually, i.e. for the largest national surfactant markets in Europe: Austria, Belgium, Czechia, Denmark, France, Germany, Hungary, Italy, Poland, Portugal, Romania, Russia, Spain, Sweden, Switzerland, the Netherlands, Türkiye, and the UK. The demand for and revenues generated with bio-based surfactants are shown in each case. In addition, demand is split by the aforementioned product types and demand and revenues are broken down for the following applications:
- Detergents and cleaners
- Industrial cleaners
- Personal care and cosmetics
- Textiles and leather
- Paints and plastics
- Other applications
Chapter 3 provides useful company profiles of the largest bio-based surfactant manufacturers, clearly arranged according to contact details, revenues, net income, product range, production sites, and short overview of the company. The study contains detailed profiles of the 30 most important producers, including Arkema S.A., BASF SE, Clariant International Ltd., Croda International Plc, Evonik Industries AG, Givaudan SA, Nouryon Specialty Chemicals B.V., and Syensqo S.A.
=> Current market studies on the global bio-based surfactants market and the entire global market for surfactants are available from Ceresana. In addition, Ceresana regularly examines the markets for various surfactant applications: Printing inks, paints and coatings, and plastics. Ceresana has also published new market studies on various packaging materials. A particular focus of Ceresana’s market research is on bio-based products. Ceresana also organizes online events on the bio-economy, for example on bio-based adhesives, bio-based paints and coatings, and investments in the bioeconomy.
Scope of the Report:
Attributes | Details |
Base Year | 2024 |
Trend Period | 2022 – 2034 |
Forecast Period | 2025 – 2034 |
Pages | 180 |
Product Types | Anionic surfactants, cationic surfactants, non-ionic surfactants, and other surfactants |
Application Areas | Detergents and cleaners, industrial cleaners, personal care and cosmetics, textiles and leather, paints and plastics, and other applications |
Company Profiles | Arkema, BASF, Clariant, Croda, Evonik, Givaudan, Nouryon, and Syensqo (Selection) |
Edition | 1st edition |
Publication | February 2026 |
FAQs
Which surfactants are biodegradable?
Biodegradable surfactants include rhamnolipids and alkyl polyglycosides.
How big is the market for natural surfactants?
The market for natural surfactants is expected to grow to EUR 10.1 billion by 2034.
What is the most important area of application for bio-based surfactants?
With a market share of 46%, household laundry detergents and cleaning products are the most important area of application for bio-based surfactants.
1 Market Data: Europe
1.1 Basics
1.2 Demand
1.3 Revenues
1.4 Demand Split by Application Area
1.4.1 Detergents & Cleaners
1.4.2 Industrial Cleaners
1.4.3 Personal Care & Cosmetics
1.4.4 Textiles & Leather
1.4.5 Paints & Plastics
1.4.6 Other Applications
1.5 Revenues Split by Application Area
1.5.1 Detergents & Cleaners
1.5.2 Industrial Cleaners
1.5.3 Personal Care & Cosmetics
1.5.4 Textiles & Leather
1.5.5 Paints & Plastics
1.5.6 Other Applications
1.6 Demand Split by Product
1.6.1 Anionic Surfactants
1.6.2 Cationic Surfactants
1.6.3 Non-Ionic Surfactants
1.6.4 Other Surfactants
2 Market Data: Country Profiles
(For each country: Revenues and demand split by application, demand split by product)
2.1 Austria
2.2 Belgium
2.3 Czechia
2.4 Denmark
2.5 France
2.6 Germany
2.7 Hungary
2.8 Italy
2.9 Poland
2.10 Portugal
2.11 Romania
2.12 Russia
2.13 Spain
2.14 Sweden
2.15 Switzerland
2.16 The Netherlands
2.17 Türkiye
2.18 United Kingdom
2.19 Rest of Europe
3 Company Profiles*
Belgium (4 Producers)
Czechia (1)
Denmark (1)
France (5)
Germany (6)
Italy (4)
Norway (1)
Poland (1)
Spain (1)
Switzerland (3)
The Netherlands (1)
United Kingdom (2)
*Note: The profiles are assigned to the country in which the company or holding is headquartered. Profiles also include JVs and subsidiaries.
Graph 1: Demand in Europe from 2022 to 2034
Graph 2: Revenues generated in Europe from 2022 to 2034, in billion USD and billion EUR
Graph 3: Demand in Austria from 2022 to 2034
Graph 4: Demand in Belgium from 2022 to 2034
Graph 5: Demand in Czechia from 2022 to 2034
Graph 6: Demand in Denmark from 2022 to 2034
Graph 7: Demand in France from 2022 to 2034
Graph 8: Demand in Germany from 2022 to 2034
Graph 9: Demand in Hungary from 2022 to 2034
Graph 10: Demand in Italy from 2022 to 2034
Graph 11: Demand in Poland from 2022 to 2034
Graph 12: Demand in Portugal from 2022 to 2034
Graph 13: Demand in Romania from 2022 to 2034
Graph 14: Demand in Russia from 2022 to 2034
Graph 15: Demand in Spain from 2022 to 2034
Graph 16: Demand in Sweden from 2022 to 2034
Graph 17: Demand in Switzerland from 2022 to 2034
Graph 18: Demand in the Netherlands from 2022 to 2034
Graph 19: Demand in Türkiye from 2022 to 2034
Graph 20: Demand in the United Kingdom from 2022 to 2034
Graph 21: Demand in the remaining countries of Europe from 2022 to 2034
Table 1: Demand in Europe from 2022 to 2034 – split by country
Table 2: Demand in Europe from 2022 to 2034 – split by application
Table 3: Demand in the “detergents & cleaners” segment in Europe from 2022 to 2034 – split by country
Table 4: Demand in the “industrial cleaners” segment in Europe from 2022 to 2034 – split by country
Table 5: Demand in the “personal care & cosmetics” segment in Europe from 2022 to 2034 – split by country
Table 6: Demand in the “textiles & leather” segment in Europe from 2022 to 2034 – split by country
Table 7: Demand in the “paints & plastics” segment in Europe from 2022 to 2034 – split by country
Table 8: Demand in the “other applications” segment in Europe from 2022 to 2034 – split by country
Table 9: Revenues generated in Europe from 2022 to 2034 – split by application
Table 10: Revenues generated in the “detergents & cleaners” segment in Europe from 2022 to 2034 – split by country
Table 11: Revenues generated in the “industrial cleaners” segment in Europe from 2022 to 2034 – split by country
Table 12: Revenues generated in the “personal care & cosmetics” segment in Europe from 2022 to 2034 – split by country
Table 13: Revenues generated in the “textiles & leather” segment in Europe from 2022 to 2034 – split by country
Table 14: Revenues generated in the “paints & plastics” segment in Europe from 2022 to 2034 – split by country
Table 15: Revenues generated in the “other applications” segment in Europe from 2022 to 2034 – split by country
Table 16: Demand in Europe from 2022 to 2034 – split by product
Table 17: Demand for “biobased anionic surfactants” in Europe from 2022 to 2034 – split by country
Table 18: Demand for “biobased cationic surfactants” in Europe from 2022 to 2034 – split by country
Table 19: Demand for “biobased non-ionic surfactants” in Europe from 2022 to 2034 – split by country
Table 20: Demand for “other biobased surfactants” in Europe from 2022 to 2034 – split by country
Table 21: Revenues generated in Austria from 2022 to 2034, in million USD and million EUR
Table 22: Revenues generated in Austria from 2022 to 2034 – split by application
Table 23: Demand in Austria from 2022 to 2034 – split by application
Table 24: Demand in Austria from 2022 to 2034 – split by product
Table 25: Revenues generated in Belgium from 2022 to 2034, in million USD and million EUR
Table 26: Revenues generated in Belgium from 2022 to 2034 – split by application
Table 27: Demand in Belgium from 2022 to 2034 – split by application
Table 28: Demand in Belgium from 2022 to 2034 – split by product
Table 29: Revenues generated in Czechia from 2022 to 2034, in million USD and million EUR
Table 30: Revenues generated in Czechia from 2022 to 2034 – split by application
Table 31: Demand in Czechia from 2022 to 2034 – split by application
Table 32: Demand in Czechia from 2022 to 2034 – split by product
Table 33: Revenues generated in Denmark from 2022 to 2034, in million USD and million EUR
Table 34: Revenues generated in Denmark from 2022 to 2034 – split by application
Table 35: Demand in Denmark from 2022 to 2034 – split by application
Table 36: Demand in Denmark from 2022 to 2034 – split by product
Table 37: Revenues generated in France from 2022 to 2034, in million USD and million EUR
Table 38: Revenues generated in France from 2022 to 2034 – split by application
Table 39: Demand in France from 2022 to 2034 – split by application
Table 40: Demand in France from 2022 to 2034 – split by product
Table 41: Revenues generated in Germany from 2022 to 2034, in million USD and million EUR
Table 42: Revenues generated in Germany from 2022 to 2034 – split by application
Table 43: Demand in Germany from 2022 to 2034 – split by application
Table 44: Demand in Germany from 2022 to 2034 – split by product
Table 45: Revenues generated in Hungary from 2022 to 2034, in million USD and million EUR
Table 46: Revenues generated in Hungary from 2022 to 2034 – split by application
Table 47: Demand in Hungary from 2022 to 2034 – split by application
Table 48: Demand in Hungary from 2022 to 2034 – split by product
Table 49: Revenues generated in Italy from 2022 to 2034, in million USD and million EUR
Table 50: Revenues generated in Italy from 2022 to 2034 – split by application
Table 51: Demand in Italy from 2022 to 2034 – split by application
Table 52: Demand in Italy from 2022 to 2034 – split by product
Table 53: Revenues generated in Poland from 2022 to 2034, in million USD and million EUR
Table 54: Revenues generated in Poland from 2022 to 2034 – split by application
Table 55: Demand in Poland from 2022 to 2034 – split by application
Table 56: Demand in Poland from 2022 to 2034 – split by product
Table 57: Revenues generated in Portugal from 2022 to 2034, in million USD and million EUR
Table 58: Revenues generated in Portugal from 2022 to 2034 – split by application
Table 59: Demand in Portugal from 2022 to 2034 – split by application
Table 60: Demand in Portugal from 2022 to 2034 – split by product
Table 61: Revenues generated in Romania from 2022 to 2034, in million USD and million EUR
Table 62: Revenues generated in Romania from 2022 to 2034 – split by application
Table 63: Demand in Romania from 2022 to 2034 – split by application
Table 64: Demand in Romania from 2022 to 2034 – split by product
Table 65: Revenues generated in Russia from 2022 to 2034, in million USD and million EUR
Table 66: Revenues generated in Russia from 2022 to 2034 – split by application
Table 67: Demand in Russia from 2022 to 2034 – split by application
Table 68: Demand in Russia from 2022 to 2034 – split by product
Table 69: Revenues generated in Spain from 2022 to 2034, in million USD and million EUR
Table 70: Revenues generated in Spain from 2022 to 2034 – split by application
Table 71: Demand in Spain from 2022 to 2034 – split by application
Table 72: Demand in Spain from 2022 to 2034 – split by product
Table 73: Revenues generated in Sweden from 2022 to 2034, in million USD and million EUR
Table 74: Revenues generated in Sweden from 2022 to 2034 – split by application
Table 75: Demand in Sweden from 2022 to 2034 – split by application
Table 76: Demand in Sweden from 2022 to 2034 – split by product
Table 77: Revenues generated in Switzerland from 2022 to 2034, in million USD and million EUR
Table 78: Revenues generated in Switzerland from 2022 to 2034 – split by application
Table 79: Demand in Switzerland from 2022 to 2034 – split by application
Table 80: Demand in Switzerland from 2022 to 2034 – split by product
Table 81: Revenues generated in the Netherlands from 2022 to 2034, in million USD and million EUR
Table 82: Revenues generated in the Netherlands from 2022 to 2034 – split by application
Table 83: Demand in the Netherlands from 2022 to 2034 – split by application
Table 84: Demand in the Netherlands from 2022 to 2034 – split by product
Table 85: Revenues generated in Türkiye from 2022 to 2034, in million USD and million EUR
Table 86: Revenues generated in Türkiye from 2022 to 2034 – split by application
Table 87: Demand in Türkiye from 2022 to 2034 – split by application
Table 88: Demand in Türkiye from 2022 to 2034 – split by product
Table 89: Revenues generated in the United Kingdom from 2022 to 2034, in million USD and million EUR
Table 90: Revenues generated in the United Kingdom from 2022 to 2034 – split by application
Table 91: Demand in the United Kingdom from 2022 to 2034 – split by application
Table 92: Demand in the United Kingdom from 2022 to 2034 – split by product
Table 93: Revenues generated in the remaining countries of Europe from 2022 to 2034, in million USD and million EUR
Table 94: Revenues generated in the remaining countries of Europe from 2022 to 2034 – split by application
Table 95: Demand in the remaining countries of Europe from 2022 to 2034 – split by application
Table 96: Demand in the remaining countries of Europe from 2022 to 2034 – split by product


