

Description
The Market Report on Biobased Solvents is now also available in parts (e.g. individual country profiles or all manufacturer profiles). Please feel free to contact us and we will immediately send you an offer for your specific selection.
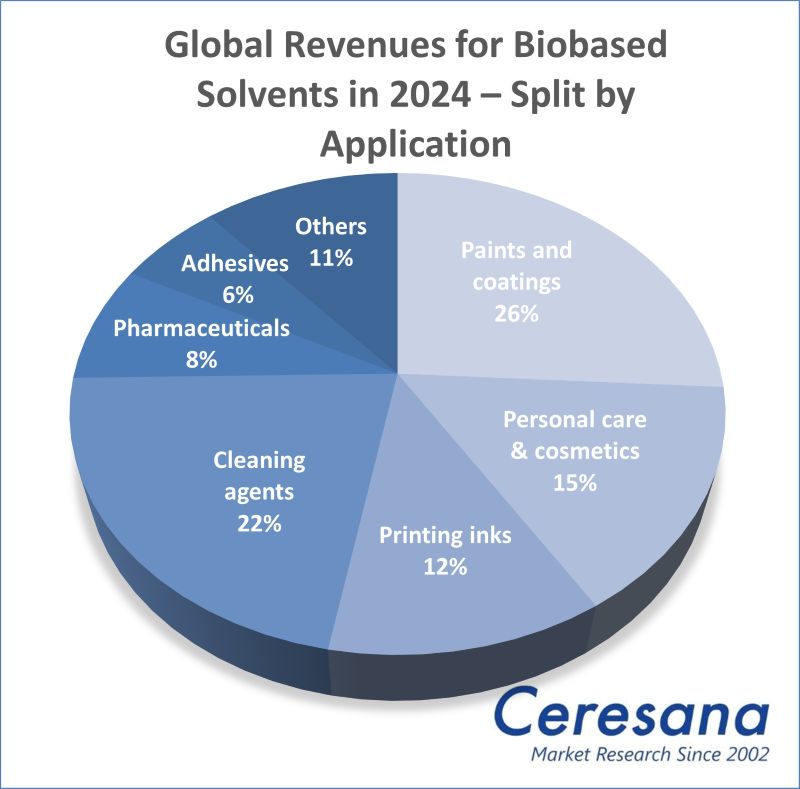
Bio and beauty go well together: Cosmetics are increasingly made using natural materials, from fragrances, colors, and emulsifiers to packaging made from bioplastics. Beauty and care products are one of the most important applications for bio-based solvents. The cosmetics, cleaning agents as well as the paints and coatings markets alone currently account for almost two thirds of sales of “green” solvents, which are at least partially produced from renewable raw materials. The latest bio-based solvents market report by Ceresana predicts that the global market for bio-based solvents will continue to grow and reach around USD 9.3 billion by 2034. For vegetable oils, alcohols such as bioethanol or biobutanol, and other organic solvents, the company’s market researchers expect average annual growth of 4.2% worldwide, and even more than 5.0% in Asia and Africa.
Natural Alcohols Instead of Petrochemicals
Water is a good and popular solvent. However, if, for example, nail varnish, acrylic paint, or even asphalt residues are to be removed, stronger chemicals are required. Industrial solvents from coal, crude oil, or natural gas are highly effective, but some of them are unfortunately also highly toxic. Volatile organic compounds in particular are considered a danger to health and the environment. In contrast, sustainable solvents based on biomass are often still more expensive, but ideally they are harmless and even biodegradable. The ingredients for organic cosmetics, for example, should meet the international standard ISO 16128. Alcohols are by far the most commonly used type of green solvent. For example, ethylene glycol, a bivalent alcohol or diol, can be obtained from fructose or cellulose. Glycerol is a triol that can be produced from used cooking oil or other natural fats, but is also produced in large quantities in the manufacture of biodiesel (fatty acid methyl ester).
Bio-Solvents for the Bio-Economy
One advantage of bio-based solvents is the possibility of utilizing biomass residues that were previously hardly used. For example, ethyl acetate, one of the most important solvents for plastics and adhesives, can be fermented from whey or molasses, i.e. from waste products from dairy processing or the sugar industry. The paint industry can use D-limonene, which can be obtained from waste peel from orange juice production. Furthermore, a by-product of paper production is used as an organic solvent for household cleaners and perfumes or for the extraction of food additives: Alpha-pinene, a terpene from coniferous tree oils. Another promising starting material for various bio-solvents is the platform chemical furfural, which can be obtained from corn cobs or sugar cane bagasse, for example.
Solutions for Many Economic Sectors
Bio-based solvents are often used for organic cosmetics, bio cleaning agents, and bio paints. However, solvents are also required in many other sectors and are among the chemicals with the greatest industrial demand worldwide. The largest consumers also include manufacturers of printing inks, adhesives, and pharmaceutical products. The food industry uses solvents, for example, to decaffeinate coffee, to dilute flavors, or to degrease surfaces. Solvents are also used for chemical manufacturing processes, cooling circuits, and de-icing agents.
Current Global Bio-Based Solvents Market Report:
Chapter 1 of the new study by Ceresana provides a comprehensive analysis of the global market for biobased solvents – including growth forecasts up to 2034: The market size and development of demand (in tonnes) and revenues (in USD and EUR) is explained for each of the following regions: Western Europe, Eastern Europe, North America, South America, Asia-Pacific, the Middle East, and Africa. Demand for and sales of organic solvents are also broken down for 7 individual application areas.
In addition, the revenues generated with the following product types are analyzed:
- Ethanol
- Butanols
- Diols & triols
- D-limonene
- Fatty acid methyl esters (FAME)
- Ethyl acetate
- Other solvents
In Chapter 2, the national markets of the 16 countries with the largest solvent sales are examined individually: Germany, France, Italy, Spain, United Kingdom, Poland, Russia, Türkiye, Canada, Mexico, USA, Brazil, China, India, Japan, and South Korea. The demand for and revenues generated with biobased solvents are shown in each case.
In addition, demand and sales are broken down for these applications:
- Paints and coatings
- Personal care & cosmetics
- Printing inks
- Cleaners
- Pharmaceuticals
- Adhesives
- Other applications
In addition to market data analysis and forecasts, the new bio-based solvents market report by Ceresana also contains background information on the general economic situation in the individual countries.
Chapter 3 provides useful company profiles of the world’s most important biobased solvent manufacturers, clearly arranged according to contact details, revenues, net income, product range, production sites, and profile summary. Detailed profiles of the top 38 producers are provided, including Archer Daniels Midland Company (ADM), Braskem SA, Cargill Inc., Clariant International Ltd., Corbion NV, Dow Inc., Kuala Lumpur Kepong Berhad (KLK) OLEO, and Merck KGaA.
=> Ceresana has just published the new, fifth edition of its market report on the entire global market for solvents. For the detergents, personal care, and cosmetics sectors in particular, a recent Ceresana market study on surfactants is also relevant. Furthermore, Ceresana regularly analyzes the global and European markets for the most important application areas of solvents: paints & coatings, printing inks, and adhesives. Bio-based materials are a focus of Ceresana’s market research.
Scope of the Report:
Attributes | Details |
Base Year | 2024 |
Trend Period | 2022 – 2034 |
Forecast Period | 2025 – 2034 |
Pages | 250 |
Product Types | Ethanol, butanol, diols & triols, d-limonene, fatty acid methyl esters (FAME), ethyl acetate, and others |
Application Areas | Paints & coatings, personal care & cosmetics, printing inks, cleaning agents, pharmaceuticals, adhesives, and others |
Company Profiles | ADM, Braskem, Cargill, Clariant, Corbion, Dow, KLK OLEO, and Merck (Selection) |
Edition | 2nd edition |
Publication | July 2025 |
FAQs
What are the advantages of bio-based solvents?
Biogenic solvents reduce the ecological footprint and are ideally non-toxic and biodegradable. They can often be obtained from waste or by-products.
What are the most important sales markets for bio-based solvents?
The largest consumers of bio-solvents are currently these application areas: paints and varnishes, printing inks, personal care and cosmetics, cleaning products.
How are sales of biosolvents developing?
Ceresana forecasts that the revenues of bio-based solvents will grow by 4.2% annually worldwide until 2034, and by more than 5.0% in Asia and Africa.
How much will the sales generated with bio-solvents increase by 2034?
Ceresana expects that global sales of bio-based solvents will grow to around USD 9.3 billion.
1 Market Data: World and Regions
1.1 World
1.1.1 Basics
1.1.1.1 Alcohols
1.1.1.2 Esters and Ethers
1.1.1.3 Salt-Based Solvents
1.1.1.4 “Green” Petrochemical Solvents
1.1.2 Demand
1.1.3 Revenues
1.1.4 Demand Split by Application Area
1.1.4.1 Paints & Coatings
1.1.4.2 Personal Care & Cosmetics
1.1.4.3 Printing Inks
1.1.4.4 Cleaners
1.1.4.5 Pharmaceuticals
1.1.4.6 Adhesives
1.1.4.7 Other Applications
1.1.5 Revenues Split by Application Area
1.1.5.1 Paints & Coatings
1.1.5.2 Personal Care & Cosmetics
1.1.5.3 Printing Inks
1.1.5.4 Cleaners
1.1.5.5 Pharmaceuticals
1.1.5.6 Adhesives
1.1.5.7 Other Applications
1.1.6 Revenues Split by Product
1.1.6.1 Ethanol
1.1.6.2 Butanols
1.1.6.3 Diols & Triols
1.1.6.4 D-Limonene
1.1.6.5 Fatty Acid Methyl Esters
1.1.6.6 Ethyl Acetate
1.1.6.7 Other Solvents
1.2 Western Europe
1.2.1 Demand
1.2.2 Revenues
1.2.3 Applications and Products
1.3 Eastern Europe
1.3.1 Demand
1.3.2 Revenues
1.3.3 Applications and Products
1.4 North America
1.4.1 Demand
1.4.2 Revenues
1.4.3 Applications and Products
1.5 South America
1.5.1 Demand
1.5.2 Revenues
1.5.3 Applications and Products
1.6 Asia-Pacific
1.6.1 Demand
1.6.2 Revenues
1.6.3 Applications and Products
1.7 Middle East
1.7.1 Demand
1.7.2 Revenues
1.7.3 Applications and Products
1.8 Africa
1.8.1 Demand
1.8.2 Revenues
1.8.3 Applications and Products
2 Market Data: Countries
(For each country: Revenues and demand split by application)
2.1 Western Europe
2.1.1 France
2.1.2 Germany
2.1.3 Italy
2.1.4 Spain
2.1.5 United Kingdom
2.1.6 Other Western Europe
2.2 Eastern Europe
2.2.1 Poland
2.2.2 Russia
2.2.3 Türkiye
2.2.4 Other Eastern Europe
2.3 North America
2.3.1 Canada
2.3.2 Mexico
2.3.3 USA
2.4 South America
2.4.1 Brazil
2.4.2 Other South America
2.5 Asia-Pacific
2.5.1 China
2.5.2 India
2.5.3 Japan
2.5.4 South Korea
2.5.5 Other Asia-Pacific
3 Company Profiles*
3.1 Western Europe
Belgium (3 Producer)
France (1)
Germany (5)
Italy (2)
Norway (1)
Switzerland (1)
The Netherlands (2)
United Kingdom (1)
3.2 Eastern Europe
Hungary (1)
3.3 North America
USA (11)
3.4 South America
Brazil (1)
3.5 Asia-Pacific
China (5)
India (1)
Malaysia (1)
Thailand (1)
3.6 Middle East
Oman (1)
*Note: The profiles are assigned to the country in which the company or holding is headquartered. Profiles also include JVs and subsidiaries.
Graph 1: Global demand from 2022 to 2034
Graph 2: Global demand from 2022 to 2034 – split by region
Graph 3: Global revenues from 2022 to 2034 in million USD and million EUR
Graph 4: Global revenues from 2022 to 2034 in million USD – split by region
Graph 5: Global revenues from 2022 to 2034 in million EUR – split by region
Graph 6: Global demand from 2022 to 2034 – split by application
Graph 7: Global demand in the “paints & coatings” segment from 2022 to 2034 – split by region
Graph 8: Global demand in the “personal care & cosmetics” segment from 2022 to 2034 – split by region
Graph 9: Global demand in the “printing inks” segment from 2022 to 2034 – split by region
Graph 10: Global demand in the “cleaners” segment from 2022 to 2034 – split by region
Graph 11: Global demand in the “pharmaceuticals” segment from 2022 to 2034 – split by region
Graph 12: Global demand in the “adhesives” segment from 2022 to 2034 – split by region
Graph 13: Global demand in the “other applications” segment from 2022 to 2034 – split by region
Graph 14: Demand in Western Europe from 2022 to 2034
Graph 15: Revenues generated in Western Europe from 2022 to 2034, in million USD and million EUR
Graph 16: Demand in Western Europe from 2022 to 2034 – split by application
Graph 17: Demand in Eastern Europe from 2022 to 2034
Graph 18: Revenues generated in Eastern Europe from 2022 to 2034, in million USD and million EUR
Graph 19: Demand in Eastern Europe from 2022 to 2034 – split by application
Graph 20: Demand in North America from 2022 to 2034
Graph 21: Revenues generated in North America from 2022 to 2034, in million USD and million EUR
Graph 22: Demand in North America from 2022 to 2034 – split by application
Graph 23: Demand in South America from 2022 to 2034
Graph 24: Revenues generated in South America from 2022 to 2034, in million USD and million EUR
Graph 25: Demand in South America from 2022 to 2034 – split by application
Graph 26: Demand in Asia-Pacific from 2022 to 2034
Graph 27: Revenues generated in Asia-Pacific from 2022 to 2034, in million USD and million EUR
Graph 28: Demand in Asia-Pacific from 2022 to 2034 – split by application
Graph 29: Demand in the Middle East from 2022 to 2034
Graph 30: Revenues generated in the Middle East from 2022 to 2034, in million USD and million EUR
Graph 31: Demand in the Middle East from 2022 to 2034 – split by application
Graph 32: Demand in Africa from 2022 to 2034
Graph 33: Revenues generated in Africa from 2022 to 2034, in million USD and million EUR
Graph 34: Demand in Africa from 2022 to 2034 – split by application
Graph 35: Demand in France from 2022 to 2034
Graph 36: Demand in Germany from 2022 to 2034
Graph 37: Demand in Italy from 2022 to 2034
Graph 38: Demand in Spain from 2022 to 2034
Graph 39: Demand in the United Kingdom from 2022 to 2034
Graph 40: Demand in Other Western Europe from 2022 to 2034
Graph 41: Demand in Poland from 2022 to 2034
Graph 42: Demand in Russia from 2022 to 2034
Graph 43: Demand in Türkiye from 2022 to 2034
Graph 44: Demand in Other Eastern Europe from 2022 to 2034
Graph 45: Demand in Canada from 2022 to 2034
Graph 46: Demand in Mexico from 2022 to 2034
Graph 47: Demand in the USA from 2022 to 2034
Graph 48: Demand in Brazil from 2022 to 2034
Graph 49: Demand in Other South America from 2022 to 2034
Graph 50: Demand in China from 2022 to 2034
Graph 51: Demand in India from 2022 to 2034
Graph 52: Demand in Japan from 2022 to 2034
Graph 53: Demand in South Korea from 2022 to 2034
Graph 54: Demand in Other Asia-Pacific from 2022 to 2034
Table 1: Global demand from 2022 to 2034 – split by region
Table 2: Global revenues from 2022 to 2034 in million USD – split by region
Table 3: Global revenues from 2022 to 2034 in million EUR – split by region
Table 4: Global demand from 2022 to 2034 – split by application
Table 5: Global demand in the “paints & coatings” segment from 2022 to 2034 – split by region
Table 6: Global demand in the “personal care & cosmetics” segment from 2022 to 2034 – split by region
Table 7: Global demand in the “printing inks” segment from 2022 to 2034 – split by region
Table 8: Global demand in the “cleaners” segment from 2022 to 2034 – split by region
Table 9: Global demand in the “pharmaceuticals” segment from 2022 to 2034 – split by region
Table 10: Global demand in the “adhesives” segment from 2022 to 2034 – split by region
Table 11: Global demand in the “other applications” segment from 2022 to 2034 – split by region
Table 12: Global revenues from 2022 to 2034 – split by application
Table 13: Global revenues generated in the “paints & coatings” segment from 2022 to 2034 – split by region
Table 14: Global revenues generated in the “personal care & cosmetics” segment from 2022 to 2034 – split by region
Table 15: Global revenues generated in the “printing inks” segment from 2022 to 2034 – split by region
Table 16: Global revenues generated in the “cleaners” segment from 2022 to 2034 – split by region
Table 17: Global revenues generated in the “pharmaceuticals” segment from 2022 to 2034 – split by region
Table 18: Global revenues generated in the “adhesives” segment from 2022 to 2034 – split by region
Table 19: Global revenues generated in the “other applications” segment from 2022 to 2034 – split by region
Table 20: Global revenues from 2022 to 2034 – split by product
Table 21: Global revenues generated with “ethanol” from 2022 to 2034 – split by region
Table 22: Global revenues generated with “butanol” from 2022 to 2034 – split by region
Table 23: Global revenues generated with “diols & triols” from 2022 to 2034 – split by region
Table 24: Global revenues generated with “D-limonene” from 2022 to 2034 – split by region
Table 25: Global revenues generated with “fatty acid methyl esters” from 2022 to 2034 – split by region
Table 26: Global revenues generated with “ethyl acetate” from 2022 to 2034 – split by region
Table 27: Global revenues generated with “other solvents” from 2022 to 2034 – split by region
Table 28: Demand in Western Europe from 2022 to 2034 – split by major country
Table 29: Revenues generated in Western Europe from 2022 to 2034, in million USD and million EUR
Table 30: Demand in Western Europe from 2022 to 2034 – split by application
Table 31: Revenues generated in Western Europe from 2022 to 2034 – split by product
Table 32: Revenues generated in Western Europe from 2022 to 2034 – split by application
Table 33: Demand in Eastern Europe from 2022 to 2034 – split by major country
Table 34: Revenues generated in Eastern Europe from 2022 to 2034, in million USD and million EUR
Table 35: Demand in Eastern Europe from 2022 to 2034 – split by application
Table 36: Revenues generated in Eastern Europe from 2022 to 2034 – split by product
Table 37: Revenues generated in Eastern Europe from 2022 to 2034 – split by application
Table 38: Demand in North America from 2022 to 2034 – split by major country
Table 39: Revenues generated in North America from 2022 to 2034, in million USD and million EUR
Table 40: Demand in North America from 2022 to 2034 – split by application
Table 41: Revenues generated in North America from 2022 to 2034 – split by product
Table 42: Revenues generated in North America from 2022 to 2034 – split by application
Table 43: Demand in South America from 2022 to 2034 – split by major country
Table 44: Revenues generated in South America from 2022 to 2034, in million USD and million EUR
Table 45: Demand in South America from 2022 to 2034 – split by application
Table 46: Revenues generated in South America from 2022 to 2034 – split by product
Table 47: Revenues generated in South America from 2022 to 2034 – split by application
Table 48: Demand in Asia-Pacific from 2022 to 2034 – split by major country
Table 49: Revenues generated in Asia-Pacific from 2022 to 2034, in million USD and million EUR
Table 50: Demand in Asia-Pacific from 2022 to 2034 – split by application
Table 51: Revenues generated in Asia-Pacific from 2022 to 2034 – split by product
Table 52: Revenues generated in Asia-Pacific from 2022 to 2034 – split by application
Table 53: Revenues generated in the Middle East from 2022 to 2034, in million USD and million EUR
Table 54: Demand in the Middle East from 2022 to 2034 – split by application
Table 55: Revenues generated in the Middle East from 2022 to 2034 – split by product
Table 56: Revenues generated in the Middle East from 2022 to 2034 – split by application
Table 57: Revenues generated in Africa from 2022 to 2034, in million USD and million EUR
Table 58: Demand in Africa from 2022 to 2034 – split by application
Table 59: Revenues generated in Africa from 2022 to 2034 – split by product
Table 60: Revenues generated in Africa from 2022 to 2034 – split by application
Table 61: Revenues generated in France from 2022 to 2034, in million USD and million EUR
Table 62: Revenues generated in France from 2022 to 2034 – split by application
Table 63: Demand in France from 2022 to 2034 – split by application
Table 64: Revenues generated in Germany from 2022 to 2034, in million USD and million EUR
Table 65: Revenues generated in Germany from 2022 to 2034 – split by application
Table 66: Demand in Germany from 2022 to 2034 – split by application
Table 67: Revenues generated in Italy from 2022 to 2034, in million USD and million EUR
Table 68: Revenues generated in Italy from 2022 to 2034 – split by application
Table 69: Demand in Italy from 2022 to 2034 – split by application
Table 70: Revenues generated in Spain from 2022 to 2034, in million USD and million EUR
Table 71: Revenues generated in Spain from 2022 to 2034 – split by application
Table 72: Demand in Spain from 2022 to 2034 – split by application
Table 73: Revenues generated in the United Kingdom from 2022 to 2034, in million USD and million EUR
Table 74: Revenues generated in the United Kingdom from 2022 to 2034 – split by application
Table 75: Demand in the United Kingdom from 2022 to 2034 – split by application
Table 76: Revenues generated in Other Western Europe from 2022 to 2034, in million USD and million EUR
Table 77: Revenues generated in Other Western Europe from 2022 to 2034 – split by application
Table 78: Demand in Other Western Europe from 2022 to 2034 – split by application
Table 79: Revenues generated in Poland from 2022 to 2034, in million USD and million EUR
Table 80: Revenues generated in Poland from 2022 to 2034 – split by application
Table 81: Demand in Poland from 2022 to 2034 – split by application
Table 82: Revenues generated in Russia from 2022 to 2034, in million USD and million EUR
Table 83: Revenues generated in Russia from 2022 to 2034 – split by application
Table 84: Demand in Russia from 2022 to 2034 – split by application
Table 85: Revenues generated in Türkiye from 2022 to 2034, in million USD and million EUR
Table 86: Revenues generated in Türkiye from 2022 to 2034 – split by application
Table 87: Demand in Türkiye from 2022 to 2034 – split by application
Table 88: Revenues generated in Other Eastern Europe from 2022 to 2034, in million USD and million EUR
Table 89: Revenues generated in Other Eastern Europe from 2022 to 2034 – split by application
Table 90: Demand in Other Eastern Europe from 2022 to 2034 – split by application
Table 91: Revenues generated in Canada from 2022 to 2034, in million USD and million EUR
Table 92: Revenues generated in Canada from 2022 to 2034 – split by application
Table 93: Demand in Canada from 2022 to 2034 – split by application
Table 94: Revenues generated in Mexico from 2022 to 2034, in million USD and million EUR
Table 95: Revenues generated in Mexico from 2022 to 2034 – split by application
Table 96: Demand in Mexico from 2022 to 2034 – split by application
Table 97: Revenues generated in the USA from 2022 to 2034, in million USD and million EUR
Table 98: Revenues generated in the USA from 2022 to 2034 – split by application
Table 99: Demand in the USA from 2022 to 2034 – split by application
Table 100: Revenues generated in Brazil from 2022 to 2034, in million USD and million EUR
Table 101: Revenues generated in Brazil from 2022 to 2034 – split by application
Table 102: Demand in Brazil from 2022 to 2034 – split by application
Table 103: Revenues generated in Other South America from 2022 to 2034, in million USD and million EUR
Table 104: Revenues generated in Other South America from 2022 to 2034 – split by application
Table 105: Demand in Other South America from 2022 to 2034 – split by application
Table 106: Revenues generated in China from 2022 to 2034, in million USD and million EUR
Table 107: Revenues generated in China from 2022 to 2034 – split by application
Table 108: Demand in China from 2022 to 2034 – split by application
Table 109: Revenues generated in India from 2022 to 2034, in million USD and million EUR
Table 110: Revenues generated in India from 2022 to 2034 – split by application
Table 111: Demand in India from 2022 to 2034 – split by application
Table 112: Revenues generated in Japan from 2022 to 2034, in million USD and million EUR
Table 113: Revenues generated in Japan from 2022 to 2034 – split by application
Table 114: Demand in Japan from 2022 to 2034 – split by application
Table 115: Revenues generated in South Korea from 2022 to 2034, in million USD and million EUR
Table 116: Revenues generated in South Korea from 2022 to 2034 – split by application
Table 117: Demand in South Korea from 2022 to 2034 – split by application
Table 118: Revenues generated in Other Asia-Pacific from 2022 to 2034, in million USD and million EUR
Table 119: Revenues generated in Other Asia-Pacific from 2022 to 2034 – split by application
Table 120: Demand in Other Asia-Pacific from 2022 to 2034 – split by application


