

Description
The Market Report on Biobased Solvents is now also available in parts (e.g. individual country profiles or all manufacturer profiles). Please feel free to contact us and we will immediately send you an offer for your specific selection.
Sometimes, water is simply not enough: Stronger solvents are often needed to dilute paints, remove dirt, or extract active ingredients for medicines. Unfortunately, xylene, toluene, and other petrochemical products are not only highly effective but can also be highly toxic. In beauty and care products in particular, more environmentally friendly and healthier alternatives that are at least partially made from renewable raw materials are increasingly being used. For the first time, Ceresana has now specifically analyzed the European market for “green” solvents. The new bio-based solvents market report forecasts that European sales of these products will grow to more than EUR 2.2 billion by 2034.
Sustainable Solutions for the Bioeconomy
Solvents are among the most economically important chemicals. They are required in many industrial sectors and different application areas. Among other applications, bio-based solvents that are harmless and ideally also biodegradable are needed for bio-based cleaning agents or bio-based paints. The ingredients for natural and organic cosmetics, for example, should meet the international standard ISO 16128. The largest consumers also include manufacturers of printing inks, adhesives, and pharmaceutical products. The food industry uses solvents, for example, to decaffeinate coffee, to dilute flavors, or to degrease surfaces. Solvents are also used for chemical manufacturing processes, cooling circuits, and de-icing agents. The market growth of green solvents is driven by stricter environmental regulations and ESG requirements. In addition to data, analysis, and forecasts regarding the market size, the new bio-based solvents market report by Ceresana also contains background information on the regulatory framework in the EU as well as the general economic situation in the individual countries.
New Uses for Organic Waste
Alcohols are by far the best-selling type of bio-solvent. For example, ethylene glycol, a bivalent alcohol or diol, can be obtained from fructose or cellulose. Glycerol is a triol that can be produced from used cooking oil or other natural fats, but is also produced in large quantities in the manufacture of biodiesel (fatty acid methyl esters, FAME). The possibility of utilizing biomass residues that were previously hardly used is generally an advantage of bio-based products. For example, ethyl acetate, one of the most important solvents for plastics and adhesives, can be fermented from whey or molasses, i.e. from waste products from dairy processing or the sugar industry. D-limonene for the paint industry can be obtained from orange peel. Furthermore, a by-product of paper production is used as an organic solvent for household cleaners and perfumes or for the extraction of food additives: Alpha-pinene, a terpene from coniferous tree oils. Another promising starting material for various bio-solvents is the platform chemical furfural, which can be produced from corn cobs or sugar cane bagasse, for example.
Current European Bio-Based Solvents Market Report:
Chapter 1 of the new study by Ceresana provides a comprehensive presentation and analysis of the European biobased solvents market – including growth forecasts up to 2034: The development of demand (in tonnes) and revenues (in USD and EUR) is included in the analysis. The market data for biobased solvents is shown individually for seven different application areas.
In addition, the revenues generated with the following product types are analyzed:
- Ethanol
- Butanols
- Diols & triols
- D-limonene
- Fatty acid methyl esters (FAME)
- Ethyl acetate
- Other solvents
In Chapter 2, the national markets of the 18 countries with the largest solvent sales in Europe are examined individually: Austria, Belgium, Czechia, France, Germany, Greece, Hungary, Italy, Poland, Portugal, Romania, Russia, Spain, Sweden, Switzerland, the Netherlands, Türkiye, and the UK. The demand for and revenues generated with biobased solvents are analyzed in each case.
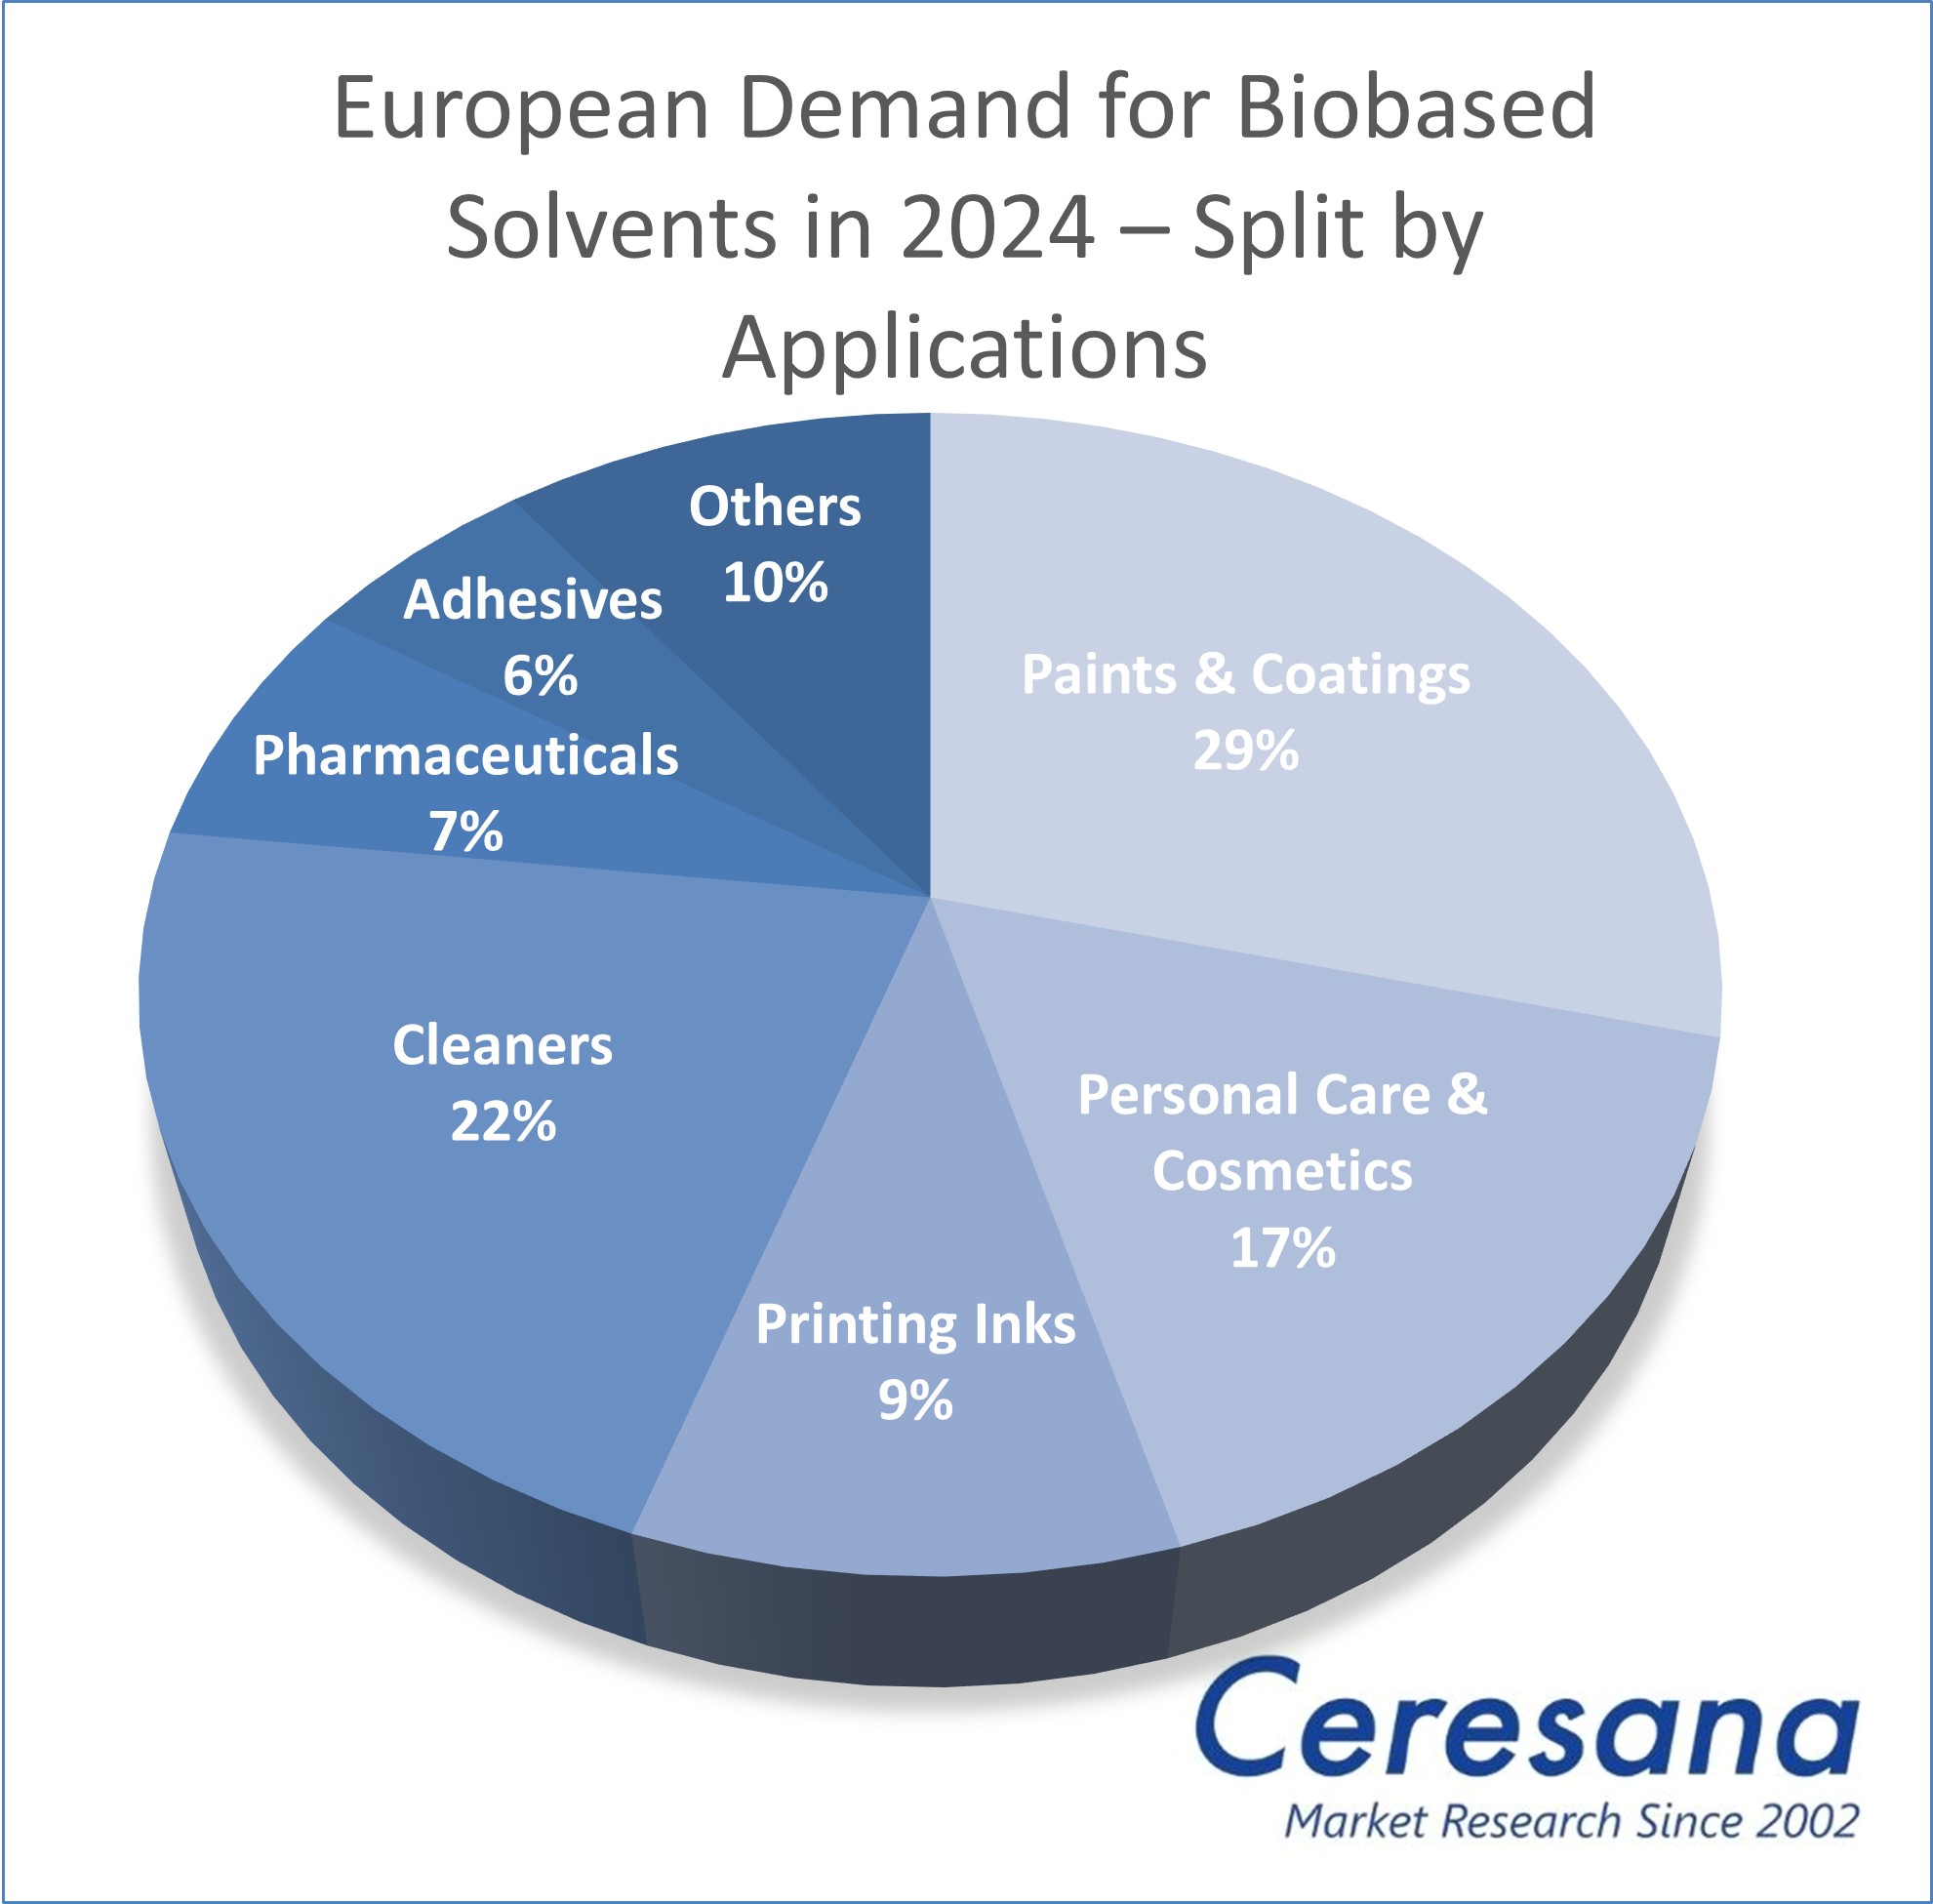
In addition, demand and sales are broken down for these applications:
- Paints and coatings
- Personal care and cosmetics
- Printing inks
- Cleaners
- Pharmaceuticals
- Adhesives
- Other applications
Chapter 3 provides useful company profiles of the largest biobased solvent manufacturers, clearly arranged according to contact details, revenues, net income, product range, production sites, and short overview of the company. The study contains detailed profiles of the 21 most important bio-solvent producers, including Clariant International Ltd, Corbion NV, Cremer Oleo Holding GmbH & Co. KG, Croda International Plc, Merck KGaA, Novamont S.p.A., and Minafin Group.
=> Ceresana also regularly publishes market studies on the entire global market for conventional or bio-based solvents. For the cleaners, personal care, and cosmetics sectors in particular, a recent Ceresana market study on surfactants is relevant. Analyses of the global and European markets for the most important solvent applications are also available, e.g. for paints and coatings, printing inks, and adhesives. Bio-based materials are a focus of Ceresana’s market research. Ceresana also organizes online events on the bio-economy, for example in spring 2026 on bio-based adhesives and bio-based paints and coatings.
Scope of the Report:
Attributes | Details |
Base Year | 2024 |
Trend Period | 2022 – 2034 |
Forecast Period | 2025 – 2034 |
Pages | 170 |
Product Types | Ethanol, butanols, diols & triols, D-limonene, fatty acid methyl esters (FAME), ethyl acetate, and others |
Application Areas | Paints and coatings, personal care and cosmetics, printing inks, cleaners, pharmaceuticals, adhesives, and others |
Company Profiles | Clariant, Corbion, Cremer Oleo, Croda, Merck, Novamont, and Minafin (Selection) |
Edition | 1st edition |
Publication | February 2026 |
FAQs
What is the advantage of bio-based solvents?
One advantage of bio-based solvents is the possibility of utilizing biomass residues that were previously hardly used.
Who produces bio-based solvents in Europe?
European manufacturers of bio-solvents include Clariant, Corbion, Cremer Oleo, Croda, Merck, Novamont, and Minafin.
What are bio-based solvents examples?
Bio-based solvents include bioethanol, biobutanol, bio-based diols and triols, D-limonene, fatty acid methyl esters, and ethyl acetate.
1 Market Data: Europe
1.1 Basics
1.1.1 Alcohols
1.1.2 Esters and Ethers
1.1.3 Salt-Based Solvents
1.1.4 „Green“ Petrochemical Solvents
1.2 Demand
1.3 Revenues
1.4 Demand Split by Application Area
1.4.1 Paints & Coatings
1.4.2 Personal Care & Cosmetics
1.4.3 Printing Inks
1.4.4 Cleaners
1.4.5 Pharmaceuticals
1.4.6 Adhesives
1.4.7 Other Applications
1.5 Revenues Split by Application Area
1.5.1 Paints & Coatings
1.5.2 Personal Care & Cosmetics
1.5.3 Printing Inks
1.5.4 Cleaners
1.5.5 Pharmaceuticals
1.5.6 Adhesives
1.5.7 Other Applications
1.6 Revenues Split by Product
1.7 Excursus: Regulations and Directives in the European Union (EU)
2 Market Data: Country Profiles
(For each country: Revenues and demand split by application)
2.1 Austria
2.2 Belgium
2.3 Czechia
2.4 France
2.5 Germany
2.6 Greece
2.7 Hungary
2.8 Italy
2.9 Poland
2.10 Portugal
2.11 Romania
2.12 Russia
2.13 Spain
2.14 Sweden
2.15 Switzerland
2.16 The Netherlands
2.17 Türkiye
2.18 United Kingdom
2.19 Rest of Europe
3 Company Profiles*
Belgium (3 producers)
Denmark (1)
France (2)
Germany (5)
Hungary (1)
Italy (3)
Norway (1)
Switzerland (2)
The Netherlands (2)
United Kingdom (1)
*Note: The profiles are assigned to the country in which the company or holding is headquartered. Profiles also include JVs and subsidiaries.
Graph 1: Demand in Europe from 2022 to 2034
Graph 2: Revenues generated in Europe from 2022 to 2034 in million USD and million EUR
Graph 3: Demand in Austria from 2022 to 2034
Graph 4: Demand in Belgium from 2022 to 2034
Graph 5: Demand in Czechia from 2022 to 2034
Graph 6: Demand in France from 2022 to 2034
Graph 7: Demand in Germany from 2022 to 2034
Graph 8: Demand in Greece from 2022 to 2034
Graph 9: Demand in Hungary from 2022 to 2034
Graph 10: Demand in Italy from 2022 to 2034
Graph 11: Demand in Poland from 2022 to 2034
Graph 12: Demand in Portugal from 2022 to 2034
Graph 13: Demand in Romania from 2022 to 2034
Graph 14: Demand in Russia from 2022 to 2034
Graph 15: Demand in Spain from 2022 to 2034
Graph 16: Demand in Sweden from 2022 to 2034
Graph 17: Demand in Switzerland from 2022 to 2034
Graph 18: Demand in the Netherlands from 2022 to 2034
Graph 19: Demand in Türkiye from 2022 to 2034
Graph 20: Demand in the United Kingdom from 2022 to 2034
Graph 21: Demand in the remaining countries of Europe from 2022 to 2034
Table 1: Demand in Europe from 2022 to 2034 – split by country
Table 2: Demand in Europe from 2022 to 2034 – split by application
Table 3: Demand in the “paints & coatings” segment in Europe from 2022 to 2034 – split by country
Table 4: Demand in the “personal care & cosmetics” segment in Europe from 2022 to 2034 – split by country
Table 5: Demand in the “printing inks” segment in Europe from 2022 to 2034 – split by country
Table 6: Demand in the “cleaners” segment in Europe from 2022 to 2034 – split by country
Table 7: Demand in the “pharmaceuticals” segment in Europe from 2022 to 2034 – split by country
Table 8: Demand in the “adhesives” segment in Europe from 2022 to 2034 – split by country
Table 9: Demand in the “other applications” segment in Europe from 2022 to 2034 – split by country
Table 10: Revenues generated in Europe from 2022 to 2034 – split by application
Table 11: Revenues generated in the “paints & coatings” segment in Europe from 2022 to 2034 – split by country
Table 12: Revenues generated in the “personal care & cosmetics” segment in Europe from 2022 to 2034 – split by country
Table 13: Revenues generated in the “printing inks” segment in Europe from 2022 to 2034 – split by country
Table 14: Revenues generated in the “cleaners” segment in Europe from 2022 to 2034 – split by country
Table 15: Revenues generated in the “pharmaceuticals” segment in Europe from 2022 to 2034 – split by country
Table 16: Revenues generated in the “adhesives” segment in Europe from 2022 to 2034 – split by country
Table 17: Revenues generated in the “other applications” segment in Europe from 2022 to 2034 – split by country
Table 18: Revenues generated in Europe from 2022 to 2034 – split by product
Table 19: Revenues generated in Austria from 2022 to 2034, in million USD and million EUR
Table 20: Revenues generated in Austria from 2022 to 2034 – split by application
Table 21: Demand in Austria from 2022 to 2034 – split by application
Table 22: Revenues generated in Belgium from 2022 to 2034, in million USD and million EUR
Table 23: Revenues generated in Belgium from 2022 to 2034 – split by application
Table 24: Demand in Belgium from 2022 to 2034 – split by application
Table 25: Revenues generated in Czechia from 2022 to 2034, in million USD and million EUR
Table 26: Revenues generated in Czechia from 2022 to 2034 – split by application
Table 27: Demand in Czechia from 2022 to 2034 – split by application
Table 28: Revenues generated in France from 2022 to 2034, in million USD and million EUR
Table 29: Revenues generated in France from 2022 to 2034 – split by application
Table 30: Demand in France from 2022 to 2034 – split by application
Table 31: Revenues generated in Germany from 2022 to 2034, in million USD and million EUR
Table 32: Revenues generated in Germany from 2022 to 2034 – split by application
Table 33: Demand in Germany from 2022 to 2034 – split by application
Table 34: Revenues generated in Greece from 2022 to 2034, in million USD and million EUR
Table 35: Revenues generated in Greece from 2022 to 2034 – split by application
Table 36: Demand in Greece from 2022 to 2034 – split by application
Table 37: Revenues generated in Hungary from 2022 to 2034, in million USD and million EUR
Table 38: Revenues generated in Hungary from 2022 to 2034 – split by application
Table 39: Demand in Hungary from 2022 to 2034 – split by application
Table 40: Revenues generated in Italy from 2022 to 2034, in million USD and million EUR
Table 41: Revenues generated in Italy from 2022 to 2034 – split by application
Table 42: Demand in Italy from 2022 to 2034 – split by application
Table 43: Revenues generated in Poland from 2022 to 2034, in million USD and million EUR
Table 44: Revenues generated in Poland from 2022 to 2034 – split by application
Table 45: Demand in Poland from 2022 to 2034 – split by application
Table 46: Revenues generated in Portugal from 2022 to 2034, in million USD and million EUR
Table 47: Revenues generated in Portugal from 2022 to 2034 – split by application
Table 48: Demand in Portugal from 2022 to 2034 – split by application
Table 49: Revenues generated in Romania from 2022 to 2034, in million USD and million EUR
Table 50: Revenues generated in Romania from 2022 to 2034 – split by application
Table 51: Demand in Romania from 2022 to 2034 – split by application
Table 52: Revenues generated in Russia from 2022 to 2034, in million USD and million EUR
Table 53: Revenues generated in Russia from 2022 to 2034 – split by application
Table 54: Demand in Russia from 2022 to 2034 – split by application
Table 55: Revenues generated in Spain from 2022 to 2034, in million USD and million EUR
Table 56: Revenues generated in Spain from 2022 to 2034 – split by application
Table 57: Demand in Spain from 2022 to 2034 – split by application
Table 58: Revenues generated in Sweden from 2022 to 2034, in million USD and million EUR
Table 59: Revenues generated in Sweden from 2022 to 2034 – split by application
Table 60: Demand in Sweden from 2022 to 2034 – split by application
Table 61: Revenues generated in Switzerland from 2022 to 2034, in million USD and million EUR
Table 62: Revenues generated in Switzerland from 2022 to 2034 – split by application
Table 63: Demand in Switzerland from 2022 to 2034 – split by application
Table 64: Revenues generated in the Netherlands from 2022 to 2034, in million USD and million EUR
Table 65: Revenues generated in the Netherlands from 2022 to 2034 – split by application
Table 66: Demand in the Netherlands from 2022 to 2034 – split by application
Table 67: Revenues generated in Türkiye from 2022 to 2034, in million USD and million EUR
Table 68: Revenues generated in Türkiye from 2022 to 2034 – split by application
Table 69: Demand in Türkiye from 2022 to 2034 – split by application
Table 70: Revenues generated in the United Kingdom from 2022 to 2034, in million USD and million EUR
Table 71: Revenues generated in the United Kingdom from 2022 to 2034 – split by application
Table 72: Demand in the United Kingdom from 2022 to 2034 – split by application
Table 73: Revenues generated in the remaining countries of Europe from 2022 to 2034, in million USD and million EUR
Table 74: Revenues generated in the remaining countries of Europe from 2022 to 2034 – split by application
Table 75: Demand in the remaining countries of Europe from 2022 to 2034 – split by application


