

Description
The biobased Paints and Coatings Market Report is now also available in parts (e.g. individual country profiles or all manufacturer profiles). Please feel free to contact us and we will immediately send you an offer for your specific selection.
Natural paints, organic paints, eco paints or even vegan paints: bio-based paints and coatings are offered under various names. “Green” coatings not only promise to be healthier and more environmentally friendly than petrochemical products – they are also increasingly developing into an interesting business segment. For the second time, Ceresana has analyzed the global market for bio-based paints and bio-based coatings used for interior and exterior building applications or as industrial and wood coatings. So far, these organic coatings only make up a small part of the overall paint and coating market. However, their sales are increasing significantly: The latest global market analysis by Ceresana forecasts that global demand for organic paints and coatings will rise to around USD 25 billion over the next 10 years. In addition to market data and forecasts, the bio-based paints and coatings market study also contains background information on the regulatory framework of the paint and coatings industry as well as the general economic situation and the situation in the construction industry (including important companies, construction activities, investments) in the individual countries.
Coatings Made from Renewable Raw Materials
Bio-based paints and coatings are produced entirely or at least partly from renewable raw materials or minerals. What exactly “bio-based” means is defined differently by different organic labels and certification bodies. Ideally, the materials should come from sustainable agriculture, forestry or fisheries and remain as unaltered as possible. For example, natural binders, pigments and fillers made from plant starch, tree resins, mussel shells or chicken feathers are developed in the spirit of the bio-economy and circular economy. This reduces dependence on oil and natural gas, and previously unused waste from the food industry can be recycled. However, organic products cannot yet compete with paints based on acrylic, vinyl or other conventional plastics in all applications, such as sophisticated automotive paints or other industrial products. Bio-based paints and coatings are often even more expensive.
Benefits for Health and Environment
Organic coating materials can be combined well with other sustainable building materials, for example with organic insulating materials, organic adhesives and organic plastics. Some bio-based paints and coatings offer better quality and economy than their fossil-based competitors, for example advantages such as higher color stability, abrasion resistance, viscosity or color coverage. Natural pigments offer a very broad color spectrum. Diffusion-open natural paints prevent condensation and mold: They allow moisture in the air to pass through, can store it and release it again. Above all, however, organic coatings are largely free of toxic additives – and are therefore also suitable for sensitive areas such as children’s rooms. The “full declaration” of all ingredients not only helps people suffering from allergies and people with chemical intolerances. The long-term effects of solvents, plasticizers, nanoparticles, and other potentially toxic paint substances often still need to be researched. In contrast, many natural materials have been known and tried and tested for centuries, such as lime paints. Biodegradable paint residues do not have to be disposed of as hazardous waste at great expense.
Current Ceresana Market Report “Bio-Based Paints and Coatings”:
Chapter 1 of the new study provides a comprehensive presentation of the global market for bio-based paints and coatings – with forecasts up to 2034: For the world regions Europe, North America, South America, Asia-Pacific and Middle East / Africa, the development of demand (tonnes) and revenue (dollars and euros) is shown.
These areas of application are being investigated:
- Construction
- Industry
- Transportation
- Wood processing
- Other applications
Roll and brush-on plasters, food and textile colors, printing inks, finger paints for children and color products for artists are not considered in this study.
In Chapter 2, the national bio-based coating markets with the largest paint sales are examined individually, i.e. 13 countries: France, Germany, Italy, Spain, United Kingdom, Canada, Mexico, USA, Brazil, China, India, Japan, and South Korea. Demand and revenues of bio-based paints and coatings are shown for the various applications.
Chapter 3 provides company profiles of the most important manufacturers of bio-based paints and coatings, clearly arranged according to contact details, revenues, net income, product range, production sites, and profile summary. In-depth profiles of 43 manufacturers are given, for example of DAW SE, Akzo Nobel N.V., PPG Industries, BASF SE, Beckers Group, TOA Paint (Thailand) Public Co., Ltd., Kangnam Jevisco Co., Ltd., and IVM S.r.l.
=> Ceresana regularly analyzes the European and global markets for paints and coatings. Special Ceresana market studies are available on various coating ingredients, such as solvents, pigments, surfactants and fillers. Current Ceresana market analyses on individual construction products, such as windows and doors, insulation materials, plastic pipes, plastic films, adhesives and “Plastics in the construction industry” in general, are also relevant for the construction industry. Printing inks are dealt with in separate Ceresana studies. Bio-based materials are a particular focus of Ceresana’s market research.
Scope of the Report:
Attributes | Details |
Base Year | 2024 |
Trend Period | 2021 – 2034 |
Forecast Period | 2025 – 2034 |
Pages | 240 |
Applications | Construction, industry, transportation, wood processing, others |
Analyzed Countries | France, Germany, Italy, Spain, United Kingdom, Canada, Mexico, USA, Brazil, China, India, Japan, and South Korea |
Company Profiles | DAW, Akzo Nobel, PPG, BASF, Beckers Group, TOA, Kangnam Jevisco, and IVM (Selection) |
Edition | 2nd edition |
Publication | June 2025 |
FAQs
How will global revenues generated with biobased paints and coatings develop until 2034?
The new market report forecasts that biobased paints will achieve global sales of around USD 25 billion by 2034.
What advantages do bio-based paints and varnishes have over their fossil-based competitors?
Bio-based paints and varnishes can be combined well with other sustainable building materials, for example with bio-insulating materials, bio-adhesives and bio-plastics. Some bio-based paints and coatings offer better quality and economy, for example advantages such as higher color stability, abrasion resistance, viscosity or color coverage. Above all, however, bio-coatings are largely free of toxic additives.
1 Market Data: World and Regions
1.1 World
1.1.1 Basics
1.1.1.1 Definition of Biobased Paints and Coatings
1.1.1.2 Product Types and Designations
1.1.1.3 Eco-Labels and Environmental Information
1.1.2 Demand
1.1.3 Revenues
1.1.4 Demand Split by Application Area
1.1.4.1 Construction
1.1.4.2 Industry
1.1.4.3 Transportation
1.1.4.4 Wood Processing
1.1.4.5 Other Applications
1.1.5 Revenues Split by Application Area
1.1.5.1 Construction
1.1.5.2 Industry
1.1.5.3 Transportation
1.1.5.4 Wood Processing
1.1.5.5 Other Applications
1.2 Europe
1.2.1 Demand
1.2.2 Revenues
1.2.3 Applications
1.3 North America
1.3.1 Demand
1.3.2 Revenues
1.3.3 Applications
1.4 South America
1.4.1 Demand
1.4.2 Revenues
1.4.3 Applications
1.5 Asia-Pacific
1.5.1 Demand
1.5.2 Revenues
1.5.3 Applications
1.6 Middle East / Africa
1.6.1 Demand
1.6.2 Revenues
1.6.3 Applications
2 Market Data: Countries
2.1 Europe
2.1.1 France
2.1.2 Germany
2.1.3 Italy
2.1.4 Spain
2.1.5 United Kingdom
2.1.6 Rest of Europe
2.2 North America
2.2.1 Canada
2.2.2 Mexico
2.2.3 USA
2.3 South America
2.3.1 Brazil
2.3.2 Other South America
2.4 Asia-Pacific
2.4.1 China
2.4.2 India
2.4.3 Japan
2.4.4 South Korea
2.4.5 Other Asia-Pacific
3 Company Profiles
3.1 Western Europe
Austria (1 Producer)
France (3)
Germany (12)
Italy (4)
Spain (1)
Switzerland (1)
The Netherlands (3)
United Kingdom (1)
3.2 Eastern Europe
Poland (1)
Slovenia (1)
3.3 North America
Canada (1)
USA (7)
3.4 Asia-Pacific
Australia (1)
China (2)
Japan (1)
New Zealand (1)
South Korea (1)
Thailand (1)
*Note: The profiles are assigned to the country in which the company or holding is headquartered. Profiles also include JVs and subsidiaries.
Graph 1: Global demand from 2022 to 2034
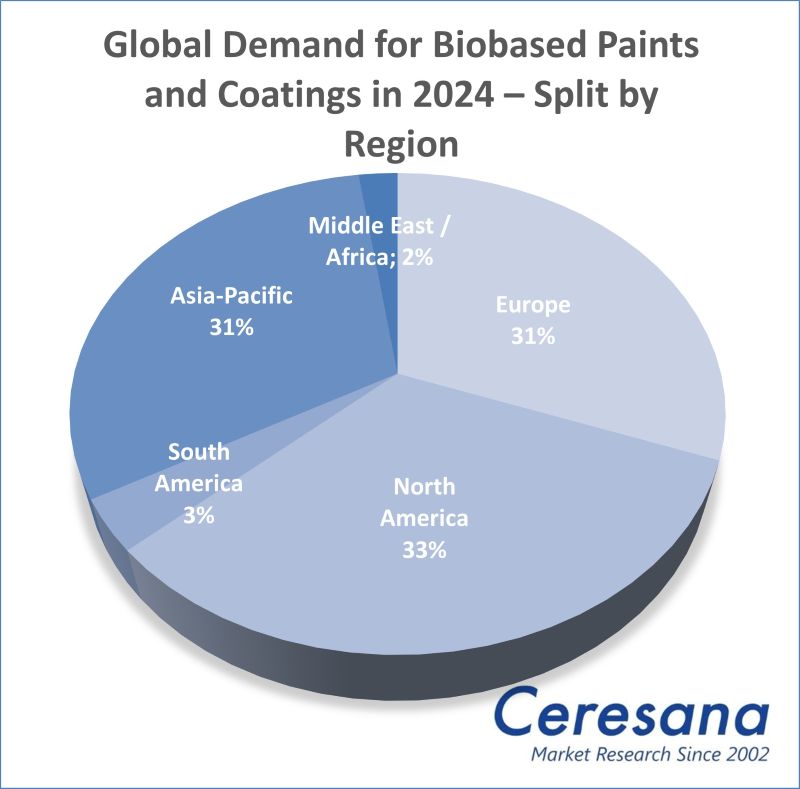
Graph 2: Global demand from 2022 to 2034 – split by region
Graph 3: Global revenues from 2022 to 2034 in billion USD and billion EUR
Graph 4: Global revenues from 2022 to 2034 in billion USD – split by region
Graph 5: Global revenues from 2022 to 2034 in billion EUR – split by region
Graph 6: Global demand from 2022 to 2034 – split by application
Graph 7: Global demand in the “construction” segment from 2022 to 2034 – split by region
Graph 8: Global demand in the “industry” segment from 2022 to 2034 – split by region
Graph 9: Global demand in the “transportation” segment from 2022 to 2034 – split by region
Graph 10: Global demand in the “wood processing” segment from 2022 to 2034 – split by region
Graph 11: Global demand in the “other applications” segment from 2022 to 2034 – split by region
Graph 12: Demand in Europe from 2022 to 2034
Graph 13: Revenues generated in Europe from 2022 to 2034 in billion USD and billion EUR
Graph 14: Demand in Europe from 2022 to 2034 – split by application
Graph 15: Demand in North America from 2022 to 2034
Graph 16: Revenues generated in North America from 2022 to 2034, in billion USD and billion EUR
Graph 17: Demand in North America from 2022 to 2034 – split by application
Graph 18: Demand in South America from 2022 to 2034
Graph 19: Revenues generated in South America from 2022 to 2034, in billion USD and billion EUR
Graph 20: Demand in South America from 2022 to 2034 – split by application
Graph 21: Demand in Asia-Pacific from 2022 to 2034
Graph 22: Revenues generated in Asia-Pacific from 2022 to 2034, in billion USD and billion EUR
Graph 23: Demand in Asia-Pacific from 2022 to 2034 – split by application
Graph 24: Demand in the Middle East / Africa from 2022 to 2034
Graph 25: Revenues generated in the Middle East / Africa from 2022 to 2034, in billion USD and billion EUR
Graph 26: Demand in the Middle East / Africa from 2022 to 2034 – split by application
Graph 27: Demand in France from 2022 to 2034
Graph 28: Demand in Germany from 2022 to 2034
Graph 29: Demand in Italy from 2022 to 2034
Graph 30: Demand in Spain from 2022 to 2034
Graph 31: Demand in the United Kingdom from 2022 to 2034
Graph 32: Demand in the remaining countries of Europe from 2022 to 2034
Graph 33: Demand in Canada from 2022 to 2034
Graph 34: Demand in Mexico from 2022 to 2034
Graph 35: Demand in the USA from 2022 to 2034
Graph 36: Demand in Brazil from 2022 to 2034
Graph 37: Demand in Other South America from 2022 to 2034
Graph 38: Demand in China from 2022 to 2034
Graph 39: Demand in India from 2022 to 2034
Graph 40: Demand in Japan from 2022 to 2034
Graph 41: Demand in South Korea from 2022 to 2034
Graph 42: Demand in Other Asia-Pacific from 2022 to 2034
Table 1: Global demand from 2022 to 2034 – split by region
Table 2: Global revenues from 2022 to 2034 in million USD – split by region
Table 3: Global revenues from 2022 to 2034 in million EUR – split by region
Table 4: Global demand from 2022 to 2034 – split by application
Table 5: Global demand in the “construction” segment from 2022 to 2034 – split by region
Table 6: Global demand in the “industry” segment from 2022 to 2034 – split by region
Table 7: Global demand in the “transportation” segment from 2022 to 2034 – split by region
Table 8: Global demand in the “wood processing” segment from 2022 to 2034 – split by region
Table 9: Global demand in the “other applications” segment from 2022 to 2034 – split by region
Table 10: Global revenues from 2022 to 2034 – split by application
Table 11: Global revenues generated in the “construction” segment from 2022 to 2034 – split by region
Table 12: Global revenues generated in the “industry” segment from 2022 to 2034 – split by region
Table 13: Global revenues generated in the “transportation” segment from 2022 to 2034 – split by region
Table 14: Global revenues generated in the “wood processing” segment from 2022 to 2034 – split by region
Table 15: Global revenues generated in the “other applications” segment from 2022 to 2034 – split by region
Table 16: Demand in Europe from 2022 to 2034 – split by major country
Table 17: Revenues generated in Europe from 2022 to 2034, in million USD and million EUR
Table 18: Revenues generated in Europe from 2022 to 2034 – split by application
Table 19: Demand in Europe from 2022 to 2034 – split by application
Table 20: Demand in North America from 2022 to 2034 – split by major country
Table 21: Revenues generated in North America from 2022 to 2034, in million USD and million EUR
Table 22: Revenues generated in North America from 2022 to 2034 – split by application
Table 23: Demand in North America from 2022 to 2034 – split by application
Table 24: Demand in South America from 2022 to 2034 – split by major country
Table 25: Revenues generated in South America from 2022 to 2034, in million USD and million EUR
Table 26: Revenues generated in South America from 2022 to 2034 – split by application
Table 27: Demand in South America from 2022 to 2034 – split by application
Table 28: Demand in Asia-Pacific from 2022 to 2034 – split by major country
Table 29: Revenues generated in Asia-Pacific from 2022 to 2034, in million USD and million EUR
Table 30: Revenues generated in Asia-Pacific from 2022 to 2034 – split by application
Table 31: Demand in Asia-Pacific from 2022 to 2034 – split by application
Table 32: Revenues generated in the Middle East / Africa from 2022 to 2034, in million USD and million EUR
Table 33: Revenues generated in the Middle East / Africa from 2022 to 2034 – split by application
Table 34: Demand in the Middle East / Africa from 2022 to 2034 – split by application
Table 35: Revenues generated in France from 2022 to 2034, in million USD and million EUR
Table 36: Revenues generated in France from 2022 to 2034 – split by application
Table 37: Demand in France from 2022 to 2034 – split by application
Table 38: Revenues generated in Germany from 2022 to 2034, in million USD and million EUR
Table 39: Revenues generated in Germany from 2022 to 2034 – split by application
Table 40: Demand in Germany from 2022 to 2034 – split by application
Table 41: Revenues generated in Italy from 2022 to 2034, in million USD and million EUR
Table 42: Revenues generated in Italy from 2022 to 2034 – split by application
Table 43: Demand in Italy from 2022 to 2034 – split by application
Table 44: Revenues generated in Spain from 2022 to 2034, in million USD and million EUR
Table 45: Revenues generated in Spain from 2022 to 2034 – split by application
Table 46: Demand in Spain from 2022 to 2034 – split by application
Table 47: Revenues generated in the United Kingdom from 2022 to 2034, in million USD and million EUR
Table 48: Revenues generated in the United Kingdom from 2022 to 2034 – split by application
Table 49: Demand in the United Kingdom from 2022 to 2034 – split by application
Table 50: Revenues generated in the remaining countries of Europe from 2022 to 2034, in million USD and million EUR
Table 51: Revenues generated in the remaining countries of Europe from 2022 to 2034 – split by application
Table 52: Demand in the remaining countries of Europe from 2022 to 2034 – split by application
Table 53: Revenues generated in Canada from 2022 to 2034, in million USD and million EUR
Table 54: Revenues generated in Canada from 2022 to 2034 – split by application
Table 55: Demand in Canada from 2022 to 2034 – split by application
Table 56: Revenues generated in Mexico from 2022 to 2034, in million USD and million EUR
Table 57: Revenues generated in Mexico from 2022 to 2034 – split by application
Table 58: Demand in Mexico from 2022 to 2034 – split by application
Table 59: Revenues generated in the USA from 2022 to 2034, in million USD and million EUR
Table 60: Revenues generated in the USA from 2022 to 2034 – split by application
Table 61: Demand in the USA from 2022 to 2034 – split by application
Table 62: Revenues generated in Brazil from 2022 to 2034, in million USD and million EUR
Table 63: Revenues generated in Brazil from 2022 to 2034 – split by application
Table 64: Demand in Brazil from 2022 to 2034 – split by application
Table 65: Revenues generated in Other South America from 2022 to 2034, in million USD and million EUR
Table 66: Revenues generated in Other South America from 2022 to 2034 – split by application
Table 67: Demand in Other South America from 2022 to 2034 – split by application
Table 68: Revenues generated in China from 2022 to 2034, in million USD and million EUR
Table 69: Revenues generated in China from 2022 to 2034 – split by application
Table 70: Demand in China from 2022 to 2034 – split by application
Table 71: Revenues generated in India from 2022 to 2034, in million USD and million EUR
Table 72: Revenues generated in India from 2022 to 2034 – split by application
Table 73: Demand in India from 2022 to 2034 – split by application
Table 74: Revenues generated in Japan from 2022 to 2034, in million USD and million EUR
Table 75: Revenues generated in Japan from 2022 to 2034 – split by application
Table 76: Demand in Japan from 2022 to 2034 – split by application
Table 77: Revenues generated in South Korea from 2022 to 2034, in million USD and million EUR
Table 78: Revenues generated in South Korea from 2022 to 2034 – split by application
Table 79: Demand in South Korea from 2022 to 2034 – split by application
Table 80: Revenues generated in Other Asia-Pacific from 2022 to 2034, in million USD and million EUR
Table 81: Revenues generated in Other Asia-Pacific from 2022 to 2034 – split by application
Table 82: Demand in Other Asia-Pacific from 2022 to 2034 – split by application


