

Description
The biobased paints and coatings market report is now also available in parts (e.g. individual country profiles or all manufacturer profiles). Please feel free to contact us and we will immediately send you an offer for your specific selection.
Back to the roots? Natural dyes have long been displaced in the construction industry by acrylic, vinyl, and other plastic paints. However, renewable raw materials are now being rediscovered as part of the bioeconomy and circular economy. So far, these organic paints only make up a small part of the overall demand for paints and coatings. However, their sales are increasing significantly: The new Ceresana market study “Bio-Based Paints and Coatings – Europe” forecasts that European demand for these products will increase to around EUR 6.6 billion over the next ten years. In addition to market data and forecasts on bio-based coatings, the market report also contains background information on the regulatory framework of the paints and coatings industry in Europe as well as the general economic situation and the situation in the construction industry (including important companies, construction activities, investments) in the individual countries.
Bio-Based Paints for Facades and Walls
For the first time, Ceresana has specifically analyzed the European bio-based paints and bio-based coatings market, including products used for interior and exterior building applications or as industrial and wood coatings. These “green” coatings are sold under various names: Natural paints, organic paints, eco paints, or even vegan paints. They are made entirely or at least partially from natural raw materials or minerals. The exact meaning of “bio-based” is defined differently by various certification bodies and eco-labels such as the German “Blue Angel”, the Austrian “Umweltzeichen”, or the “Nordic Swan”. Ideally, the raw materials should come from sustainable agriculture, forestry, or fisheries and remain as unaltered as possible. The main components of bio-based paints, i.e. pigments, binders, solvents, and fillers, can be obtained from plant starch, tree resins, mussel shells, or chicken feathers, among other things. This not only reduces dependence on crude oil and natural gas, but also allows previously unused biomass waste to be utilized.
Healthy and Environmentally Friendly Paints
Although organic coatings are not yet suitable for all applications and are often more expensive than petrochemical paints, they promise to be healthier and more environmentally friendly. In addition, they can be combined well with other sustainable building materials, for example with bio-based insulating materials, bio-based adhesives, and bioplastics. Some bio-based paints and coatings offer better quality and economy than their fossil-based competitors, such as higher color stability, abrasion resistance, viscosity, or color coverage. Natural pigments offer a very broad color spectrum. Diffusion-open natural paints prevent condensation and mold: They allow moisture in the air to pass through, can store it and release it again. Above all, however, organic coatings are largely free of toxic additives – and are therefore also suitable for sensitive areas such as children’s rooms. The “full declaration” of all ingredients not only helps people suffering from allergies and people with chemical intolerances. The long-term effects of solvents, plasticizers, nanoparticles, and other potentially toxic paint substances often still need to be researched. In contrast, many natural materials have been known and tried and tested for centuries, such as lime paints. Last but not least, biodegradable paint residues do not have to be disposed of as hazardous waste at great expense.
The Current European Market Report “Bio-Based Paints and Coatings”:
Chapter 1 of the new biobased paints and coatings market study provides a comprehensive presentation and analysis of the European market for bio-based paints and coatings – with growth forecasts up to 2034. The development of demand (in tonnes) and revenues (in USD and EUR) is included in the analysis.
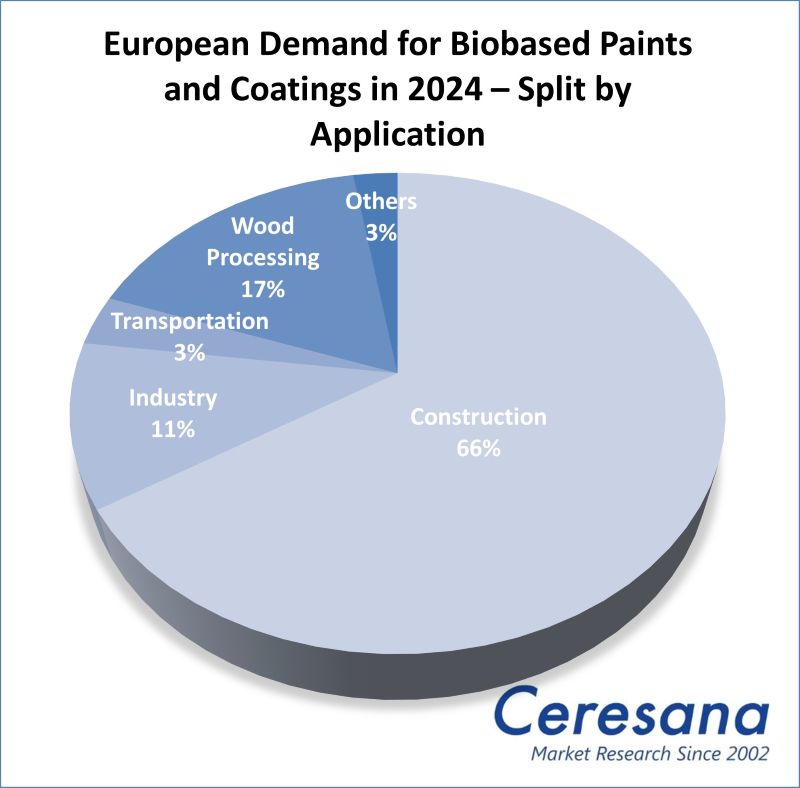
These areas of application and their market shares are being investigated:
- Construction
- Industry
- Transportation
- Wood processing
- Other applications
Roll and brush-on plasters, food and textile colors, printing inks, finger paints for children, and color products for artists are not considered in this study.
In Chapter 2, the largest national markets for bio-based paints and coatings in Europe are examined individually, i.e. 16 countries: Austria, Belgium, Czechia, Finland, France, Germany, Italy, Poland, Portugal, Russia, Spain, Sweden, Switzerland, the Netherlands, Türkiye, and the United Kingdom. The bio-based paints and coatings market size is analyzed in the form of demand and revenues for the various applications.
Chapter 3 provides useful company profiles of the most important European bio-based paints and coatings manufacturers, clearly arranged according to contact details, financial figures such as revenues and net income, product range, production sites, and profile summary. Detailed profiles of 33 manufacturers are supplied, e.g. DAW SE, BASF SE, Akzo Nobel N.V., IVM S.r.l., Beckers Group, Tikkurila Oyj, and Renner Italia S.P.A.
=> Ceresana regularly analyzes the European and global markets for paints and coatings. A market study on the entire global market for bio-based paints and coatings is currently available from Ceresana. Other new market studies relevant to the construction industry and other consumers of coatings analyze, for example, pigments, solvents, surfactants, insulation materials, adhesives, fillers, plastic pipes, as well as windows and doors. Printing inks are examined in separate Ceresana studies. Bio-based materials are a particular focus of Ceresana’s market research and Ceresana’s events.
Scope of the Report:
Attributes | Details |
Base Year | 2024 |
Trend Period | 2022 – 2034 |
Forecast Period | 2025 – 2034 |
Pages | 180 |
Applications | Construction, industry, transportation, wood processing, and others |
Analyzed Countries | Austria, Belgium, Czechia, Finland, France, Germany, Italy, Poland, Portugal, Russia, Spain, Sweden, Switzerland, the Netherlands, Türkiye, and the United Kingdom |
Company Profiles | DAW, BASF, AkzoNobel, IVM, Beckers, Tikkurila, and Renner (Selection) |
Edition | 1st edition |
Publication | August 2025 |
FAQs
How will the European bio-based paints and bio-based coatings market develop?
Market value is expected to increase to around EUR 6.6 billion in the next ten years.
What is the largest application area for bio-based paints and coatings?
In 2024, the construction industry accounted for the largest share of demand for bio-based paints and coatings.
What are the most important bio-based paints and coatings manufacturers in Europe?
DAW SE, BASF SE, AkzoNobel N.V., IVM S.r.l., Beckers Group, Tikkurila Oyj, and Renner Italia S.P.A.
1 Market Data: Europe
1.1 Basics
1.1.1 Definition of Biobased Paints and Coatings
1.1.2 Product Types and Designations
1.1.3 Eco-Labels and Environmental Information
1.2 Demand
1.3 Revenues
1.4 Demand Split by Application Area
1.4.1 Construction
1.4.2 Industry
1.4.3 Transportation
1.4.4 Wood Processing
1.4.5 Other Applications
1.5 Revenues Split by Application Area
1.5.1 Construction
1.5.2 Industry
1.5.3 Transportation
1.5.4 Wood Processing
1.5.5 Other Applications
1.6 Excursus: Regulations and Directives in the European Union (EU)
1.6.1 General Information
1.6.2 Construction
2 Market Data: Country Profiles
(For each country: Revenues and demand split by application)
2.1 Austria
2.2 Belgium
2.3 Czechia
2.4 Finland
2.5 France
2.6 Germany
2.7 Italy
2.8 Poland
2.9 Portugal
2.10 Russia
2.11 Spain
2.12 Sweden
2.13 Switzerland
2.14 The Netherlands
2.15 Türkiye
2.16 United Kingdom
2.17 Rest of Europe
3 Company Profiles*
Austria (1 Producer)
Finland (1)
France (4)
Germany (14)
Italy (4)
Poland (1)
Slovenia (1)
Spain (2)
Switzerland (1)
The Netherlands (3)
United Kingdom (1)
*Note: The profiles are assigned to the country in which the company or holding is headquartered. Profiles also include JVs and subsidiaries.
Graph 1: Demand in Europe from 2022 to 2034
Graph 2: Revenues generated in Europe from 2022 to 2034, in billion USD and billion EUR
Graph 3: Demand in Austria from 2022 to 2034
Graph 4: Demand in Belgium from 2022 to 2034
Graph 5: Demand in Czechia from 2022 to 2034
Graph 6: Demand in Finland from 2022 to 2034
Graph 7: Demand in France from 2022 to 2034
Graph 8: Demand in Germany from 2022 to 2034
Graph 9: Demand in Italy from 2022 to 2034
Graph 10: Demand in Poland from 2022 to 2034
Graph 11: Demand in Portugal from 2022 to 2034
Graph 12: Demand in Russia from 2022 to 2034
Graph 13: Demand in Spain from 2022 to 2034
Graph 14: Demand in Sweden from 2022 to 2034
Graph 15: Demand in Switzerland from 2022 to 2034
Graph 16: Demand in the Netherlands from 2022 to 2034
Graph 17: Demand in Türkiye from 2022 to 2034
Graph 18: Demand in the United Kingdom from 2022 to 2034
Graph 19: Demand in the remaining countries of Europe from 2022 to 2034
Table 1: Demand in Europe from 2022 to 2034 – split by country
Table 2: Demand in Europe from 2022 to 2034 – split by application
Table 3: Demand in the “construction” segment in Europe from 2022 to 2034 – split by country
Table 4: Demand in the “industry” segment in Europe from 2022 to 2034 – split by country
Table 5: Demand in the “transportation” segment in Europe from 2022 to 2034 – split by country
Table 6: Demand in the “wood processing” segment in Europe from 2022 to 2034 – split by country
Table 7: Demand in the “other applications” segment in Europe from 2022 to 2034 – split by country
Table 8: Revenues generated in Europe from 2022 to 2034 – split by application
Table 9: Revenues generated in the “construction” segment in Europe from 2022 to 2034 – split by country
Table 10: Revenues generated in the “industry” segment in Europe from 2022 to 2034 – split by country
Table 11: Revenues generated in the “transportation” segment in Europe from 2022 to 2034 – split by country
Table 12: Revenues generated in the “wood processing” segment in Europe from 2022 to 2034 – split by country
Table 13: Revenues generated in the “other applications” segment in Europe from 2022 to 2034 – split by country
Table 14: Revenues generated in Austria from 2022 to 2034, in million USD and million EUR
Table 15: Revenues generated in Austria from 2022 to 2034 – split by application
Table 16: Demand in Austria from 2022 to 2034 – split by application
Table 17: Revenues generated in Belgium from 2022 to 2034, in million USD and million EUR
Table 18: Revenues generated in Belgium from 2022 to 2034 – split by application
Table 19: Demand in Belgium from 2022 to 2034 – split by application
Table 20: Revenues generated in Czechia from 2022 to 2034, in million USD and million EUR
Table 21: Revenues generated in Czechia from 2022 to 2034 – split by application
Table 22: Demand in Czechia from 2022 to 2034 – split by application
Table 23: Revenues generated in Finland from 2022 to 2034, in million USD and million EUR
Table 24: Revenues generated in Finland from 2022 to 2034 – split by application
Table 25: Demand in Finland from 2022 to 2034 – split by application
Table 26: Revenues generated in France from 2022 to 2034, in million USD and million EUR
Table 27: Revenues generated in France from 2022 to 2034 – split by application
Table 28: Demand in France from 2022 to 2034 – split by application
Table 29: Revenues generated in Germany from 2022 to 2034, in million USD and million EUR
Table 30: Revenues generated in Germany from 2022 to 2034 – split by application
Table 31: Demand in Germany from 2022 to 2034 – split by application
Table 32: Revenues generated in Italy from 2022 to 2034, in million USD and million EUR
Table 33: Revenues generated in Italy from 2022 to 2034 – split by application
Table 34: Demand in Italy from 2022 to 2034 – split by application
Table 35: Revenues generated in Poland from 2022 to 2034, in million USD and million EUR
Table 36: Revenues generated in Poland from 2022 to 2034 – split by application
Table 37: Demand in Poland from 2022 to 2034 – split by application
Table 38: Revenues generated in Portugal from 2022 to 2034, in million USD and million EUR
Table 39: Revenues generated in Portugal from 2022 to 2034 – split by application
Table 40: Demand in Portugal from 2022 to 2034 – split by application
Table 41: Revenues generated in Russia from 2022 to 2034, in million USD and million EUR
Table 42: Revenues generated in Russia from 2022 to 2034 – split by application
Table 43: Demand in Russia from 2022 to 2034 – split by application
Table 44: Revenues generated in Spain from 2022 to 2034, in million USD and million EUR
Table 45: Revenues generated in Spain from 2022 to 2034 – split by application
Table 46: Demand in Spain from 2022 to 2034 – split by application
Table 47: Revenues generated in Sweden from 2022 to 2034, in million USD and million EUR
Table 48: Revenues generated in Sweden from 2022 to 2034 – split by application
Table 49: Demand in Sweden from 2022 to 2034 – split by application
Table 50: Revenues generated in Switzerland from 2022 to 2034, in million USD and million EUR
Table 51: Revenues generated in Switzerland from 2022 to 2034 – split by application
Table 52: Demand in Switzerland from 2022 to 2034 – split by application
Table 53: Revenues generated in the Netherlands from 2022 to 2034, in million USD and million EUR
Table 54: Revenues generated in the Netherlands from 2022 to 2034 – split by application
Table 55: Demand in the Netherlands from 2022 to 2034 – split by application
Table 56: Revenues generated in Türkiye from 2022 to 2034, in million USD and million EUR
Table 57: Revenues generated in Türkiye from 2022 to 2034 – split by application
Table 58: Demand in Türkiye from 2022 to 2034 – split by application
Table 59: Revenues generated in the United Kingdom from 2022 to 2034, in million USD and million EUR
Table 60: Revenues generated in the United Kingdom from 2022 to 2034 – split by application
Table 61: Demand in the United Kingdom from 2022 to 2034 – split by application
Table 62: Revenues generated in the remaining countries of Europe from 2022 to 2034, in million USD and million EUR
Table 63: Revenues generated in the remaining countries of Europe from 2022 to 2034 – split by application
Table 64: Demand in the remaining countries of Europe from 2022 to 2034 – split by application


