

Description
The Bio-based Packaging Market Report is now also available in parts (e.g. individual country profiles or all manufacturer profiles). Please feel free to contact us and we will immediately send you an offer for your specific selection.
New factories for bioplastics open up new prospects for the packaging industry. Larger production capacities for polylactic acid (PLA), thermoplastic starch (TPS), and other biopolymers improve supply capability and predictability, lower prices, and make sustainable alternatives to fossil-based plastics economically attractive. Ceresana has now analyzed the global market for packaging materials made from bio-based and/or biodegradable plastics for the second time and presents the findings in its bio-based plastic packaging market report. Films, containers, bottles, and cups of all kinds, closures and lids, as well as labels, adhesive tapes, and loose-fill packaging chips made from renewable resources: The market research institute expects global sales generated with these products to grow to around USD 32.1 billion by 2034. In the context of the bioeconomy and circular economy, bio-based packaging is also being promoted by government regulation, for example through the new EU packaging and packaging waste regulation (PPWR), compostability requirements, or the obligation to reduce CO2 emissions.
Bacteria Produce Films for Food
Not only is the production of bio-based and biodegradable polymers being expanded, their quality is also being constantly improved. Heat-resistant grades, customized barrier properties, and other innovations expand the range of possible applications and areas of use. PLA, usually made from plant starch, is currently the most important bioplastic on the packaging market with a share of 30%. In second place comes packaging made from bio-based plastics that are not biodegradable, such as polyethylene and PET made from sugar cane ethanol. Ceresana forecasts the highest growth rates for PLA packaging and for packaging made from polyhydroxyalkanoates (PHA), which are produced with the help of bacteria through fermentation and are biodegradable. The demand for this eco-friendly packaging is expected to increase by 10.3% and 7.2% respectively by 2034. One remaining challenge regarding bioplastics is that they are often still more expensive than plastics made from crude oil or natural gas. The dependence on sugar and starch as precursors can be a risk and lead to strong price fluctuations.
Opportunities and Challenges for Bioplastic Packaging
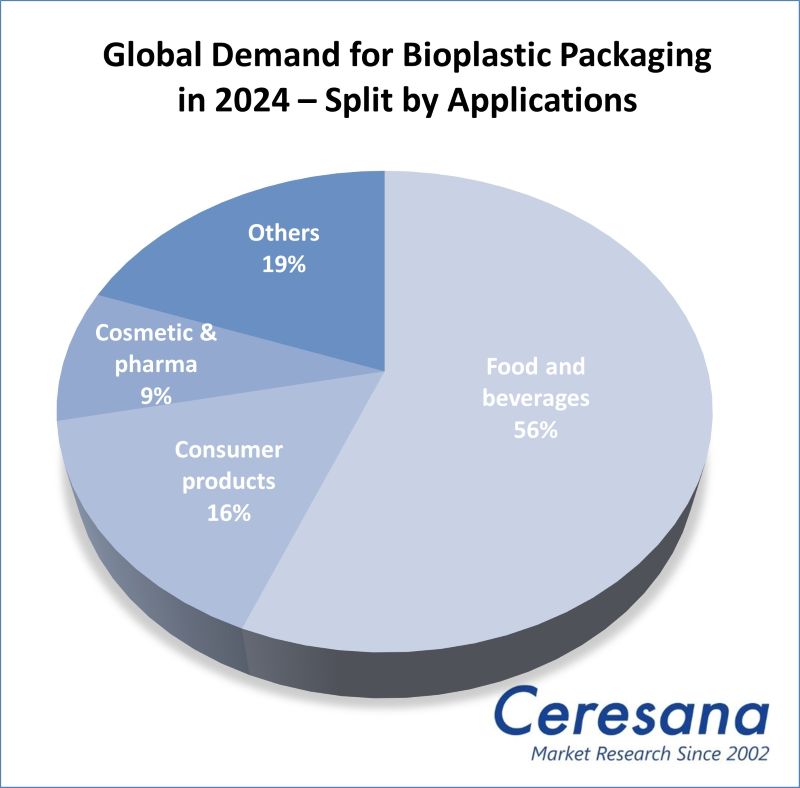
Bioplastics are increasingly being processed into durable high-performance products. However, by far the most important area of application today is short-life packaging for food and beverages. Almost 56% of all bio-based and biodegradable packaging materials are used for products such as bread, fruit, and vegetables, water, soft drinks, and juices, dairy products, chilled and frozen foods, ready meals and convenience foods, spreads, sauces, and condiments. Not only in Europe, the trend is moving towards sustainable and environmentally friendly packaging: The world region with the largest demand for bioplastic packaging is currently Asia-Pacific, with a global market share of around 42%. The European Union finances itself with a levy on non-recycled plastic packaging, among other things. In addition to market data and forecasts, the study also provides information on the regulatory framework in the EU as well as the general economic situation and the situation in the packaging industry (including important companies, market size, recycling rates) in the individual countries.
Current Bio-Based Plastic Packaging Market Report:
Chapter 1 of the new Ceresana market study provides a comprehensive presentation and analysis of the global bioplastic packaging market with growth forecasts up to 2034: The development of demand (in tonnes) and revenues (in USD and EUR) is shown for each region of the world. In addition, the different types of packaging, areas of application, and products are examined individually. Rigid packaging (e.g. bottles, cans, and containers) and flexible packaging (bags, sacks, pouches, and films) are handled separately.
The following bioplastic packaging applications are examined in detail:
- Food and beverages
- Consumer products
- Cosmetics and pharmaceuticals
- Other packaging applications
For the regions Europe, North America, Asia-Pacific, and the “Rest of the World (ROW)”, the packaging market is broken down for the different types of bioplastics:
- Polylactic acid (PLA)
- Starch-based plastics (especially TPS)
- Polybutylene adipate terephthalate (PBAT)
- Polyhydroxyalkanoates (PHA)
- Other biodegradable plastics
- Bio-based but non-biodegradable plastics
In addition, the demand for each individual type of bioplastic is broken down for the respective packaging application areas.
In Chapter 2, the 11 most important bioplastic packaging sales markets are examined individually. The largest national markets are: France, Germany, Italy, Spain, the Netherlands, the United Kingdom, the USA, China, Japan, South Korea, and Taiwan. The following are shown in each case: Demand and revenues split by the individual application areas, demand per bioplastic and packaging type (flexible and rigid packaging).
To give an overview of the bioplastic packaging industry, Chapter 3 provides useful company profiles of the largest bioplastic packaging manufacturers, clearly arranged according to contact details, revenues, net income, product range, production sites, and profile summary. Detailed profiles of 35 packaging companies are supplied, e.g. of Amcor plc, Huhtamäki Oyj, Northern Technologies International Corporation (NTIC), Novolex Holdings, LLC, Plantic Technologies Ltd., Shanghai Yifu Packing Products Co., Ltd., Sphere SA, and Taghleef Industries.
=> Ceresana regularly analyzes the European and global packaging market. Current Ceresana market studies are available on various packaging materials, such as on labels, plastic closures, plastic containers, as well as flexible and rigid plastic packaging. Ceresana analyzes the markets for individual types of plastic, such as PLA, PVC, or EPS, as well as possible plastic alternatives, such as metal, corrugated board, or cartonboard. Packaging application areas are also a topic for in-depth Ceresana studies, for example food packaging or packaging for cosmetics and personal care products. A particular focus of Ceresana’s market research is on bio-based products. For example, new studies deal with adhesives, surfactants, and solvents made from renewable raw materials. Ceresana also organizes online events on the bio-economy, for example on bioplastics and bio-based packaging.
Scope of the Report:
Attributes | Details |
Base Year | 2024 |
Trend Period | 2022 – 2034 |
Forecast Period | 2025 – 2034 |
Pages | 230 |
Application Areas | Food and beverages, consumer goods, cosmetics and pharma, other packaging areas |
Product Groups | Polylactic acid (PLA), starch-based plastics, polybutylene adipate terephthalate (PBAT), polyhydroxyalkanoates (PHA), other biodegradable plastics, bio-based but non-biodegradable plastics |
Company Profiles | Amcor, Huhtamäki, NTIC, Novolex, Plantic, Shanghai Yifu, Sphere, and Taghleef. (Selection) |
Edition | 2nd edition |
Publication | October 2025 |
FAQs
How will sales generated with bio-based packaging develop by 2034?
The market research institute Ceresana expects global sales generated with these products to grow to around USD 32.1 billion by 2034.
Which types of bioplastic packaging are expected to see the highest growth?
Ceresana forecasts the highest growth rates for PLA packaging and for packaging made from polyhydroxyalkanoates (PHA). The demand for this eco-friendly packaging is expected to increase by 10.3% and 7.2% respectively by 2034.
Which sales market had the highest demand for bioplastic packaging?
The most important sales market in 2024 was the “food and beverages” area, which accounted for almost 56% of all packaging.
1 Market Data: World and Regions
1.1 World
1.1.1 Basics
1.1.1.1 Definitions and Characteristics of Bioplastics
1.1.1.2 Regulation and Certification
1.1.2 Demand
1.1.3 Revenues
1.1.4 Demand Split by Application Area
1.1.4.1 Food and Beverages
1.1.4.2 Consumer Products
1.1.4.3 Cosmetics and Pharmaceuticals
1.1.4.4 Other Applications
1.1.5 Revenues Split by Application Area
1.1.5.1 Food and Beverages
1.1.5.2 Consumer Products
1.1.5.3 Cosmetics and Pharmaceuticals
1.1.5.4 Other Applications
1.1.6 Demand Split by Product
1.1.6.1 Polylactic Acid (PLA)
1.1.6.2 Starch-Based Plastics
1.1.6.3 Polybutylene Adipate Terephthalate (PBAT)
1.1.6.4 Polyhydroxyalkanoates (PHA)
1.1.6.5 Other Biodegradable Plastics
1.1.6.6 Non-Biodegradable Bioplastics
1.1.7 Demand Split by Type
1.1.7.1 Rigid Packaging
1.1.7.2 Flexible Packaging
1.2 Europe
1.2.1 Demand
1.2.2 Revenues
1.2.3 Applications and Products
1.3 North America
1.3.1 Demand
1.3.2 Revenues
1.3.3 Applications and Products
1.4 Asia-Pacific
1.4.1 Demand
1.4.2 Revenues
1.4.3 Applications and Products
1.5 Rest of the World
1.5.1 Demand
1.5.2 Revenues
1.5.3 Applications and Products
2 Market Data: Countries
2.1 Europe
2.1.1 France
2.1.2 Germany
2.1.3 Italy
2.1.4 Spain
2.1.5 The Netherlands
2.1.6 United Kingdom
2.1.7 Other Europe
2.2 North America
2.2.1 Canada & Mexico
2.2.2 USA
2.3 Asia-Pacific
2.3.1 China
2.3.2 Japan
2.3.3 South Korea
2.3.4 Taiwan
2.3.5 Other Asia-Pacific
3 Company Profiles
3.1 Western Europe
Finland (2 Producers)
France (2)
Germany (3)
Italy (1)
Norway (1)
Spain (1)
Switzerland (1)
3.2 Eastern Europe
Romania (2)
3.3 North America
Canada (2)
USA (5)
3.4 South America
Brazil (1)
3.5 Asia-Pacific
Australia (3)
China (4)
India (1)
South Korea (2)
Taiwan (1)
3.5 Middle East
Israel (1)
United Arab Emirates (1)
3.5 Africa
South Africa (1)
*Note: The profiles are assigned to the country in which the company or holding is headquartered. Profiles also include JVs and subsidiaries.
Graph 1: Global demand from 2022 to 2034
Graph 2: Global demand from 2022 to 2034 – split by region
Graph 3: Global revenues from 2022 to 2034 in billion USD and billion EUR
Graph 4: Global revenues from 2022 to 2034 in billion USD – split by region
Graph 5: Global revenues from 2022 to 2034 in billion EUR – split by region
Graph 6: Global demand from 2022 to 2034 – split by application
Graph 7: Global demand in the “food and beverages” segment from 2022 to 2034 – split by region
Graph 8: Global demand in the “consumer products” segment from 2022 to 2034 – split by region
Graph 9: Global demand in the “cosmetics and pharmaceuticals” segment from 2022 to 2034 – split by region
Graph 10: Global demand in the “other applications” segment from 2022 to 2034 – split by region
Graph 11: Global demand from 2022 to 2034 – split by product
Graph 12: Global demand for “PLA packaging” from 2022 to 2034 – split by region
Graph 13: Global demand for “starch-based plastic packaging” from 2022 to 2034 – split by region
Graph 14: Global demand for “PBAT packaging” from 2022 to 2034 – split by region
Graph 15: Global demand for “PHA packaging” from 2022 to 2034 – split by region
Graph 16: Global demand for “packaging made from other biodegradable plastics” from 2022 to 2034 – split by region
Graph 17: Global demand for “packaging made from non-biodegradable bioplastics” from 2022 to 2034 – split by region
Graph 18: Demand in Europe from 2022 to 2034
Graph 19: Revenues generated in Europe from 2022 to 2034, in billion USD and billion EUR
Graph 20: Demand in Europe from 2022 to 2034 – split by application
Graph 21: Demand in North America from 2022 to 2034
Graph 22: Revenues generated in North America from 2022 to 2034, in billion USD and billion EUR
Graph 23: Demand in North America from 2022 to 2034 – split by application
Graph 24: Demand in Asia-Pacific from 2022 to 2034
Graph 25: Revenues generated in Asia-Pacific from 2022 to 2034, in billion USD and billion EUR
Graph 26: Demand in Asia-Pacific from 2022 to 2034 – split by application
Graph 27: Demand in the rest of the world from 2022 to 2034
Graph 28: Revenues generated in the rest of the world from 2022 to 2034, in billion USD and billion EUR
Graph 29: Demand in the rest of the world from 2022 to 2034 – split by application
Graph 30: Demand in France from 2022 to 2034
Graph 31: Demand in Germany from 2022 to 2034
Graph 32: Demand in Italy from 2022 to 2034
Graph 33: Demand in Spain from 2022 to 2034
Graph 34: Demand in the Netherlands from 2022 to 2034
Graph 35: Demand in the United Kingdom from 2022 to 2034
Graph 36: Demand in the remaining countries of Europe from 2022 to 2034
Graph 37: Demand in Canada & Mexico from 2022 to 2034
Graph 38: Demand in the USA from 2022 to 2034
Graph 39: Demand in China from 2022 to 2034
Graph 40: Demand in Japan from 2022 to 2034
Graph 41: Demand in South Korea from 2022 to 2034
Graph 42: Demand in Taiwan from 2022 to 2034
Graph 43: Demand in the remaining countries of Asia-Pacific from 2022 to 2034
Table 1: Global demand from 2022 to 2034 – split by region
Table 2: Global revenues from 2022 to 2034 in million USD – split by region
Table 3: Global revenues from 2022 to 2034 in million EUR – split by region
Table 4: Global demand from 2022 to 2034 – split by application
Table 5: Global demand in the “food and beverages” segment from 2022 to 2034 – split by region
Table 6: Global demand in the “consumer products” segment from 2022 to 2034 – split by region
Table 7: Global demand in the “cosmetics and pharmaceuticals” segment from 2022 to 2034 – split by region
Table 8: Global demand in the “other applications” segment from 2022 to 2034 – split by region
Table 9: Global revenues from 2022 to 2034 – split by application
Table 10: Global revenues generated in the “food and beverages” segment from 2022 to 2034 – split by region
Table 11: Global revenues generated in the “consumer products” segment from 2022 to 2034 – split by region
Table 12: Global revenues generated in the “cosmetics and pharmaceuticals” segment from 2022 to 2034 – split by region
Table 13: Global revenues generated in the “other applications” segment from 2022 to 2034 – split by region
Table 14: Global demand from 2022 to 2034 – split by product
Table 15: Global demand for “PLA packaging” from 2022 to 2034 – split by region
Table 16: Global demand for “PLA packaging” from 2022 to 2034 – split by application
Table 17: Global demand for “starch-based plastic packaging” from 2022 to 2034 – split by region
Table 18: Global demand for “starch-based plastic packaging” from 2022 to 2034 – split by application
Table 19: Global demand for “PBAT packaging” from 2022 to 2034 – split by region
Table 20: Global demand for “PBAT packaging” from 2022 to 2034 – split by application
Table 21: Global demand for “PHA packaging” from 2022 to 2034 – split by region
Table 22: Global demand for “PHA packaging” from 2022 to 2034 – split by application
Table 23: Global demand for “packaging made from other biodegradable plastics” from 2022 to 2034 – split by region
Table 24: Global demand for “packaging made from other biodegradable plastics” from 2022 to 2034 – split by application
Table 25: Global demand for “packaging made from non-biodegradable bioplastics” from 2022 to 2034 – split by region
Table 26: Global demand for “packaging made from non-biodegradable bioplastics” from 2022 to 2034 – split by application
Table 27: Global demand from 2022 to 2034 – split by type
Table 28: Global demand for “rigid bioplastic packaging” from 2022 to 2034 – split by region
Table 29: Global demand for “flexible bioplastic packaging” from 2022 to 2034 – split by region
Table 30: Demand in Europe from 2022 to 2034 – split by major country
Table 31: Revenues generated in Europe from 2022 to 2034, in million USD and million EUR
Table 32: Revenues generated in Europe from 2022 to 2034 – split by application
Table 33: Demand in Europe from 2022 to 2034 – split by application
Table 34: Demand in Europe from 2022 to 2034 – split by product
Table 35: Demand in Europe from 2022 to 2034 – split by type
Table 36: Demand for “PLA packaging” in Europe from 2022 to 2034 – split by application
Table 37: Demand for “starch-based plastic packaging” in Europe from 2022 to 2034 – split by application
Table 38: Demand for “PBAT packaging” in Europe from 2022 to 2034 – split by application
Table 39: Demand for “PHA packaging” in Europe from 2022 to 2034 – split by application
Table 40: Demand for “packaging made from other biodegradable plastics” in Europe from 2022 to 2034 – split by application
Table 41: Demand for “packaging made from non-biodegradable bioplastics” in Europe from 2022 to 2034 – split by application
Table 42: Demand in North America from 2022 to 2034 – split by major country
Table 43: Revenues generated in North America from 2022 to 2034, in million USD and million EUR
Table 44: Revenues generated in North America from 2022 to 2034 – split by application
Table 45: Demand in North America from 2022 to 2034 – split by application
Table 46: Demand in North America from 2022 to 2034 – split by product
Table 47: Demand in North America from 2022 to 2034 – split by type
Table 48: Demand for “PLA packaging” in North America from 2022 to 2034 – split by application
Table 49: Demand for “starch-based plastic packaging” in North America from 2022 to 2034 – split by application
Table 50: Demand for “PBAT packaging” in North America from 2022 to 2034 – split by application
Table 51: Demand for “PHA packaging” in North America from 2022 to 2034 – split by application
Table 52: Demand for “packaging made from other biodegradable plastics” in North America from 2022 to 2034 – split by application
Table 53: Demand for “packaging made from non-biodegradable bioplastics” in North America from 2022 to 2034 – split by application
Table 54: Demand in Asia-Pacific from 2022 to 2034 – split by major country
Table 55: Revenues generated in Asia-Pacific from 2022 to 2034, in million USD and million EUR
Table 56: Revenues generated in Asia-Pacific from 2022 to 2034 – split by application
Table 57: Demand in Asia-Pacific from 2022 to 2034 – split by application
Table 58: Demand in Asia-Pacific from 2022 to 2034 – split by product
Table 59: Demand in Asia-Pacific from 2022 to 2034 – split by type
Table 60: Demand for “PLA packaging” in Asia-Pacific from 2022 to 2034 – split by application
Table 61: Demand for “starch-based plastic packaging” in Asia-Pacific from 2022 to 2034 – split by application
Table 62: Demand for “PBAT packaging” in Asia-Pacific from 2022 to 2034 – split by application
Table 63: Demand for “PHA packaging” in Asia-Pacific from 2022 to 2034 – split by application
Table 64: Demand for “packaging made from other biodegradable plastics” in Asia-Pacific from 2022 to 2034 – split by application
Table 65: Demand for “packaging made from non-biodegradable bioplastics” in Asia-Pacific from 2022 to 2034 – split by application
Table 66: Revenues generated in the rest of the world from 2022 to 2034, in million USD and million EUR
Table 67: Revenues generated in the rest of the world from 2022 to 2034 – split by application
Table 68: Demand in the rest of the world from 2022 to 2034 – split by application
Table 69: Demand in the rest of the world from 2022 to 2034 – split by product
Table 70: Demand in the rest of the world from 2022 to 2034 – split by type
Table 71: Demand for “PLA packaging” in the rest of the world from 2022 to 2034 – split by application
Table 72: Demand for “starch-based plastic packaging” in the rest of the world from 2022 to 2034 – split by application
Table 73: Demand for “PBAT packaging” in the rest of the world from 2022 to 2034 – split by application
Table 74: Demand for “PHA packaging” in the rest of the world from 2022 to 2034 – split by application
Table 75: Demand for “packaging made from other biodegradable plastics” in the rest of the world from 2022 to 2034 – split by application
Table 76: Demand for “packaging made from non-biodegradable bioplastics” in the rest of the world from 2022 to 2034 – split by application
Table 77: Revenues generated in France from 2022 to 2034, in million USD and million EUR
Table 78: Revenues generated in France from 2022 to 2034 – split by application
Table 79: Demand in France from 2022 to 2034 – split by application
Table 80: Demand in France from 2022 to 2034 – split by product
Table 81: Demand in France from 2022 to 2034 – split by type
Table 82: Revenues generated in Germany from 2022 to 2034, in million USD and million EUR
Table 83: Revenues generated in Germany from 2022 to 2034 – split by application
Table 84: Demand in Germany from 2022 to 2034 – split by application
Table 85: Demand in Germany from 2022 to 2034 – split by product
Table 86: Demand in Germany from 2022 to 2034 – split by type
Table 87: Revenues generated in Italy from 2022 to 2034, in million USD and million EUR
Table 88: Revenues generated in Italy from 2022 to 2034 – split by application
Table 89: Demand in Italy from 2022 to 2034 – split by application
Table 90: Demand in Italy from 2022 to 2034 – split by product
Table 91: Demand in Italy from 2022 to 2034 – split by type
Table 92: Revenues generated in Spain from 2022 to 2034, in million USD and million EUR
Table 93: Revenues generated in Spain from 2022 to 2034 – split by application
Table 94: Demand in Spain from 2022 to 2034 – split by application
Table 95: Demand in Spain from 2022 to 2034 – split by product
Table 96: Demand in Spain from 2022 to 2034 – split by type
Table 97: Revenues generated in the Netherlands from 2022 to 2034, in million USD and million EUR
Table 98: Revenues generated in the Netherlands from 2022 to 2034 – split by application
Table 99: Demand in the Netherlands from 2022 to 2034 – split by application
Table 100: Demand in the Netherlands from 2022 to 2034 – split by product
Table 101: Demand in the Netherlands from 2022 to 2034 – split by type
Table 102: Revenues generated in the United Kingdom from 2022 to 2034, in million USD and million EUR
Table 103: Revenues generated in the United Kingdom from 2022 to 2034 – split by application
Table 104: Demand in the United Kingdom from 2022 to 2034 – split by application
Table 105: Demand in the United Kingdom from 2022 to 2034 – split by product
Table 106: Demand in the United Kingdom from 2022 to 2034 – split by type
Table 107: Revenues generated in the remaining countries of Europe from 2022 to 2034, in million USD and million EUR
Table 108: Revenues generated in the remaining countries of Europe from 2022 to 2034 – split by application
Table 109: Demand in the remaining countries of Europe from 2022 to 2034 – split by application
Table 110: Demand in the remaining countries of Europe from 2022 to 2034 – split by product
Table 111: Demand in the remaining countries of Europe from 2022 to 2034 – split by type
Table 112: Revenues generated in Canada & Mexico from 2022 to 2034, in million USD and million EUR
Table 113: Revenues generated in Canada & Mexico from 2022 to 2034 – split by application
Table 114: Demand in Canada & Mexico from 2022 to 2034 – split by application
Table 115: Demand in Canada & Mexico from 2022 to 2034 – split by product
Table 116: Demand in Canada & Mexico from 2022 to 2034 – split by type
Table 117: Revenues generated in the USA from 2022 to 2034, in million USD and million EUR
Table 118: Revenues generated in the USA from 2022 to 2034 – split by application
Table 119: Demand in the USA from 2022 to 2034 – split by application
Table 120: Demand in the USA from 2022 to 2034 – split by product
Table 121: Demand in the USA from 2022 to 2034 – split by type
Table 122: Revenues generated in China from 2022 to 2034, in million USD and million EUR
Table 123: Revenues generated in China from 2022 to 2034 – split by application
Table 124: Demand in China from 2022 to 2034 – split by application
Table 125: Demand in China from 2022 to 2034 – split by product
Table 126: Demand in China from 2022 to 2034 – split by type
Table 127: Revenues generated in Japan from 2022 to 2034, in million USD and million EUR
Table 128: Revenues generated in Japan from 2022 to 2034 – split by application
Table 129: Demand in Japan from 2022 to 2034 – split by application
Table 130: Demand in Japan from 2022 to 2034 – split by product
Table 131: Demand in Japan from 2022 to 2034 – split by type
Table 132: Revenues generated in South Korea from 2022 to 2034, in million USD and million EUR
Table 133: Revenues generated in South Korea from 2022 to 2034 – split by application
Table 134: Demand in South Korea from 2022 to 2034 – split by application
Table 135: Demand in South Korea from 2022 to 2034 – split by product
Table 136: Demand in South Korea from 2022 to 2034 – split by type
Table 137: Revenues generated in Taiwan from 2022 to 2034, in million USD and million EUR
Table 138: Revenues generated in Taiwan from 2022 to 2034 – split by application
Table 139: Demand in Taiwan from 2022 to 2034 – split by application
Table 140: Demand in Taiwan from 2022 to 2034 – split by product
Table 141: Demand in Taiwan from 2022 to 2034 – split by type
Table 142: Revenues generated in the remaining countries of Asia-Pacific from 2022 to 2034, in million USD and million EUR
Table 143: Revenues generated in the remaining countries of Asia-Pacific from 2022 to 2034 – split by application
Table 144: Demand in the remaining countries of Asia-Pacific from 2022 to 2034 – split by application
Table 145: Demand in the remaining countries of Asia-Pacific from 2022 to 2034 – split by product
Table 146: Demand in the remaining countries of Asia-Pacific from 2022 to 2034 – split by type


