

Description
The biobased adhesives market report is now also available in parts (e.g. individual country profiles or all manufacturer profiles). Please feel free to contact us and we will immediately send you an offer for your specific selection.
Hotmelt, construction adhesives, or thermoplastic adhesive films for lightweight composites: Bio-adhesives are increasingly meeting even demanding standards for high-performance industrial products. On the one hand, adhesives are still produced in large quantities from crude oil. On the other hand, adhesive products that are at least partially made from renewable plant or animal raw materials are conquering more and more areas of application. For the first time, Ceresana has now specifically analyzed the European market for “green” adhesives. The new market study “Biobased Adhesives – Europe” forecasts that sales of sustainable adhesives in this region of the world will grow to around EUR 1.5 billion by 2034.
Rising Demand for Bio-Adhesives for Bags, Plywood, and Furniture
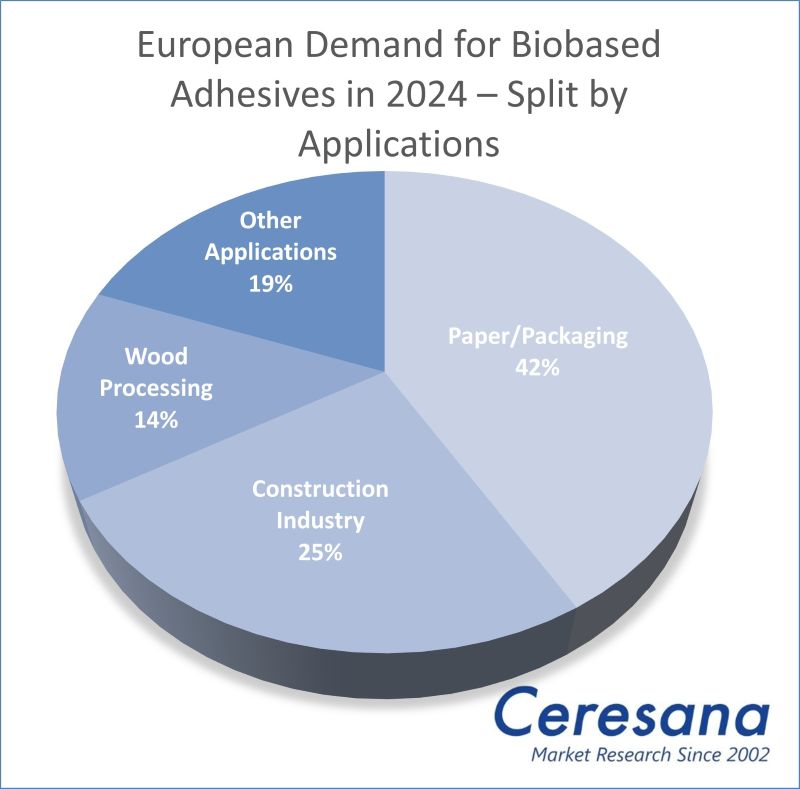
The demand for environmentally friendly and high-performance bio-adhesives is increasing, particularly in the paper and packaging industry, the construction sector, and wood processing. Paper bags, corrugated board, bottle labels, and other packaging materials alone currently account for almost a third of sales generated with bio-based adhesives across Europe. The packaging industry can combine bio-adhesives well with bioplastics such as polylactic acid (PLA), while the construction industry may use them together with bio-based paints, coatings, and insulating materials. Ceresana expects market growth of 3.4% per year for the European bio-based adhesives market. In addition to market data and forecasts, the bio-based adhesives market report by Ceresana also contains background information on the general economic situation and the situation in the construction industry in the individual countries.
How Much “Bio” Content Do Bio-Attributed Adhesives Contain?
In order to reduce the ecological footprint and dependence on crude oil and natural gas, biogenic raw materials are increasingly being added to conventional adhesives made from petrochemical plastics. These innovative products are then sold as “bio-attributed” or “mass balance approach” adhesives, but are not without controversy. Adhesive research and development is certainly making great progress. Non-toxic, solvent-free, low-emission, and recyclable solutions are being sought in the spirit of the bioeconomy and circular economy. Ideally, bio-based adhesives are even biodegradable at the end of their life cycle and meet e.g. the ISO 17088 standard for compostable plastics. Another advantage is the possible recycling of previously unused waste and inexpensive by-products, such as lignin from the paper industry, keratin from chicken feathers, collagen from bones, or platform chemicals that are produced during the manufacture of biofuels from biomass.
Current European Bio-Based Adhesives Market Report:
Chapter 1 of Ceresana’s new market study provides a comprehensive presentation and analysis of the European market for biobased adhesives with forecasts up to 2034: The development of demand (in tonnes) and revenues (in USD and EUR) is included in the analysis.
In addition, revenues and demand are broken down by the application areas:
- Paper/packaging
- Construction industry
- Wood processing
- Other applications.
In Chapter 2, the largest national markets for bio-based adhesives in Europe are examined individually, i.e. 16 countries: Austria, Belgium, Czechia, Finland, France, Germany, Greece, Italy, Poland, Russia, Spain, Sweden, Switzerland, the Netherlands, Türkiye, and the United Kingdom. The demand for and revenues generated with bio-based adhesives are analyzed in each case.
In addition, demand and revenues are further broken down by the following adhesive application areas:
- Paper/packaging
- Construction industry
- Wood processing
- Other applications
Chapter 3 provides useful company profiles of the largest bio-based adhesive manufacturers, clearly arranged according to contact details, revenues, net income, product range, production sites, and short overview of the company. In-depth profiles of 22 manufacturers are given, for example of Soudal Group, Stora Enso Oyj, Kerakoll SpA, Crespel & Deiters Group, Royal Avebe, Durante Adesivi S.p.A., artimelt AG, and Power Adhesives Ltd.
=> Ceresana regularly analyzes the European and global markets for adhesives. Current Ceresana market studies are also available on various application areas for adhesives, such as insulation materials, labels, and packaging materials such as corrugated board or cardboard. Ceresana also analyzes the markets for various components of adhesives, such as individual types of polymers, solvents, surfactants, fillers, and flame retardants. A focus of Ceresana’s market research is on bio-based products. Ceresana also organizes online events on the bio-economy, for example in spring 2026 on bio-based adhesives and bio-based paints and coatings.
Scope of the Report:
Attributes | Details |
Base Year | 2024 |
Trend Period | 2022 – 2034 |
Forecast Period | 2025 – 2034 |
Pages | 131 |
Application Areas | Paper/packaging, construction industry, wood processing, and other applications |
Company Profiles | Soudal, Stora Enso, Kerakoll, Crespel & Deiters, Royal Avebe, Durante Adesivi, artimelt, and Power Adhesives (selection) |
Edition | 1st edition |
Publication | January 2026 |
FAQs
What are bio-based adhesives?
Bio-based adhesives are adhesive products that are at least partially made from renewable plant or animal raw materials.
Who produces bio-based adhesives?
The European manufacturers of bio-adhesives include Soudal, Stora Enso, Kerakoll, Crespel & Deiters, Royal Avebe, Durante Adesivi, artimelt, and Power Adhesives.
Is the market for bio-based adhesives growing?
Yes, Ceresana expects market growth of 3.4% per year for the European bio-based adhesives market over the next 10 years.
1 Market Data: Europe
1.1 Basics
1.2 Demand
1.3 Revenues
1.4 Demand Split by Application Area
1.4.1 Paper/Packaging
1.4.2 Construction Industry
1.4.3 Wood Processing
1.4.4 Other Applications
1.5 Revenues Split by Application Area
1.5.1 Paper/Packaging
1.5.2 Construction Industry
1.5.3 Wood Processing
1.5.4 Other Applications
2 Market Data: Countries
2.1 Austria
2.2 Belgium
2.3 Czechia
2.4 Finland
2.5 France
2.6 Germany
2.7 Greece
2.8 Italy
2.9 Poland
2.10 Russia
2.11 Spain
2.12 Sweden
2.13 Switzerland
2.14 The Netherlands
2.15 Türkiye
2.16 United Kingdom
2.17 Rest of Europe
3 Company Profiles*
Belgium (1 Producer)
Finland (1)
France (1)
Germany (2)
Italy (5)
Poland (1)
Spain (1)
Switzerland (3)
The Netherlands (3)
Ukraine (1)
United Kingdom (3)
*Note: The profiles are assigned to the country in which the company or holding is headquartered. Profiles also include JVs and subsidiaries.
Graph 1: Demand in Europe from 2022 to 2034
Graph 2: Revenues generated in Europe from 2022 to 2034 in million USD and million EUR
Graph 3: Demand in Austria from 2022 to 2034
Graph 4: Demand in Belgium from 2022 to 2034
Graph 5: Demand in Czechia from 2022 to 2034
Graph 6: Demand in Finland from 2022 to 2034
Graph 7: Demand in France from 2022 to 2034
Graph 8: Demand in Germany from 2022 to 2034
Graph 9: Demand in Greece from 2022 to 2034
Graph 10: Demand in Italy from 2022 to 2034
Graph 11: Demand in Poland from 2022 to 2034
Graph 12: Demand in Russia from 2022 to 2034
Graph 13: Demand in Spain from 2022 to 2034
Graph 14: Demand in Sweden from 2022 to 2034
Graph 15: Demand in Switzerland from 2022 to 2034
Graph 16: Demand in the Netherlands from 2022 to 2034
Graph 17: Demand in Türkiye from 2022 to 2034
Graph 18: Demand in the United Kingdom from 2022 to 2034
Graph 19: Demand in the remaining countries of Europe from 2022 to 2034
Table 1: Demand in Europe from 2022 to 2034 – split by country
Table 2: Demand in Europe from 2022 to 2034 – split by application
Table 3: Demand in the “paper/packaging” segment in Europe from 2022 to 2034 – split by country
Table 4: Demand in the “construction industry” segment in Europe from 2022 to 2034 – split by country
Table 5: Demand in the “wood processing” segment in Europe from 2022 to 2034 – split by country
Table 6: Demand in the “other applications” segment in Europe from 2022 to 2034 – split by country
Table 7: Revenues generated in Europe from 2022 to 2034 – split by application
Table 8: Revenues generated in the “paper/packaging” segment in Europe from 2022 to 2034 – split by country
Table 9: Revenues generated in the “construction industry” segment in Europe from 2022 to 2034 – split by country
Table 10: Revenues generated in the “wood processing” segment in Europe from 2022 to 2034 – split by country
Table 11: Revenues generated in the “other applications” segment in Europe from 2022 to 2034 – split by country
Table 12: Revenues generated in Austria from 2022 to 2034, in million USD and million EUR
Table 13: Revenues generated in Austria from 2022 to 2034 – split by application
Table 14: Demand in Austria from 2022 to 2034 – split by application
Table 15: Revenues generated in Belgium from 2022 to 2034, in million USD and million EUR
Table 16: Revenues generated in Belgium from 2022 to 2034 – split by application
Table 17: Demand in Belgium from 2022 to 2034 – split by application
Table 18: Revenues generated in Czechia from 2022 to 2034, in million USD and million EUR
Table 19: Revenues generated in Czechia from 2022 to 2034 – split by application
Table 20: Demand in Czechia from 2022 to 2034 – split by application
Table 21: Revenues generated in Finland from 2022 to 2034, in million USD and million EUR
Table 22: Revenues generated in Finland from 2022 to 2034 – split by application
Table 23: Demand in Finland from 2022 to 2034 – split by application
Table 24: Revenues generated in France from 2022 to 2034, in million USD and million EUR
Table 25: Revenues generated in France from 2022 to 2034 – split by application
Table 26: Demand in France from 2022 to 2034 – split by application
Table 27: Revenues generated in Germany from 2022 to 2034, in million USD and million EUR
Table 28: Revenues generated in Germany from 2022 to 2034 – split by application
Table 29: Demand in Germany from 2022 to 2034 – split by application
Table 30: Revenues generated in Greece from 2022 to 2034, in million USD and million EUR
Table 31: Revenues generated in Greece from 2022 to 2034 – split by application
Table 32: Demand in Greece from 2022 to 2034 – split by application
Table 33: Revenues generated in Italy from 2022 to 2034, in million USD and million EUR
Table 34: Revenues generated in Italy from 2022 to 2034 – split by application
Table 35: Demand in Italy from 2022 to 2034 – split by application
Table 36: Revenues generated in Poland from 2022 to 2034, in million USD and million EUR
Table 37: Revenues generated in Poland from 2022 to 2034 – split by application
Table 38: Demand in Poland from 2022 to 2034 – split by application
Table 39: Revenues generated in Russia from 2022 to 2034, in million USD and million EUR
Table 40: Revenues generated in Russia from 2022 to 2034 – split by application
Table 41: Demand in Russia from 2022 to 2034 – split by application
Table 42: Revenues generated in Spain from 2022 to 2034, in million USD and million EUR
Table 43: Revenues generated in Spain from 2022 to 2034 – split by application
Table 44: Demand in Spain from 2022 to 2034 – split by application
Table 45: Revenues generated in Sweden from 2022 to 2034, in million USD and million EUR
Table 46: Revenues generated in Sweden from 2022 to 2034 – split by application
Table 47: Demand in Sweden from 2022 to 2034 – split by application
Table 48: Revenues generated in Switzerland from 2022 to 2034, in million USD and million EUR
Table 49: Revenues generated in Switzerland from 2022 to 2034 – split by application
Table 50: Demand in Switzerland from 2022 to 2034 – split by application
Table 51: Revenues generated in the Netherlands from 2022 to 2034, in million USD and million EUR
Table 52: Revenues generated in the Netherlands from 2022 to 2034 – split by application
Table 53: Demand in the Netherlands from 2022 to 2034 – split by application
Table 54: Revenues generated in Türkiye from 2022 to 2034, in million USD and million EUR
Table 55: Revenues generated in Türkiye from 2022 to 2034 – split by application
Table 56: Demand in Türkiye from 2022 to 2034 – split by application
Table 57: Revenues generated in the United Kingdom from 2022 to 2034, in million USD and million EUR
Table 58: Revenues generated in the United Kingdom from 2022 to 2034 – split by application
Table 59: Demand in the United Kingdom from 2022 to 2034 – split by application
Table 60: Revenues generated in the remaining countries of Europe from 2022 to 2034, in million USD and million EUR
Table 61: Revenues generated in the remaining countries of Europe from 2022 to 2034 – split by application
Table 62: Demand in the remaining countries of Europe from 2022 to 2034 – split by application


