

Description
The biobased adhesives market report is now also available in parts (e.g. individual country profiles or all manufacturer profiles). Please feel free to contact us and we will immediately send you an offer for your specific selection.
Sugar, starch, or soy: more than 15% of all adhesives are already made from renewable raw materials. In the spirit of the bio-economy and circular economy, the proportion of plant- and animal-based raw materials used in adhesive products is also constantly increasing. The latest Ceresana report on the global market for bio-based adhesives forecasts that sales of “green” glues will increase to around USD 4.5 billion by 2034. In order to reduce the ecological footprint and dependence on crude oil and natural gas, bio-based components are increasingly being added to conventional adhesives made from petrochemical plastics. Growth in demand for high-performance and eco-friendly adhesives is particularly occurring in the construction sector, the field of paper and packaging, and the woodworking industry.
Burgeoning Field of Innovation: Bio-Based Adhesives
Adhesives made from biogenic raw materials are no longer limited to special applications, such as starch adhesives for bottle labels and corrugated cardboard packaging, methyl cellulose in wallpaper paste, or collagen for musical instruments. With the help of additives and copolymers, bio glues are also increasingly meeting demanding standards for industrial high-performance products, for example for hot-melt adhesives, construction adhesives, or thermoplastic adhesive films for lightweight composites. Dynamic research and development is driven by the search for non-toxic, solvent-free, low-emission, and recyclable adhesives. Ideally, bio-based products are even biodegradable at the end of their life cycle and meet e.g. the ISO 17088 standard for compostable plastics. Another advantage is the possible recycling of previously unused waste and inexpensive by-products, such as lignin from the paper industry, keratin from chicken feathers, or platform chemicals that are produced during the manufacture of biofuels from biomass.
Plant-Based Adhesives for Packaging and Construction Products
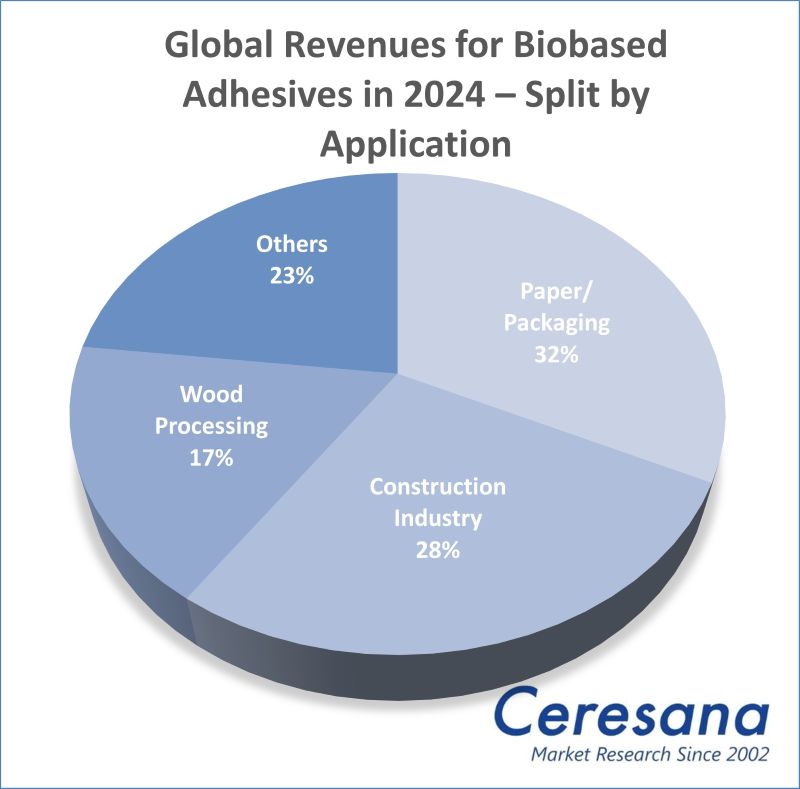
Today, more than 13 million tonnes of adhesives are consumed globally each year. Most of these are still adhesives made from fossil raw materials. However, the demand for biobased adhesives is increasing significantly: In the coming years, Ceresana expects annual growth of over 4.8% in Asia, Africa, and the Middle East and just over 3% in Western Europe and North America. The largest individual markets are the application areas of paper and packaging, the construction industry, and the wood industry with products such as plywood panels and furniture. Paper bags and other packaging alone currently account for almost a third of global sales of bio-based adhesives. In the packaging industry, a combination with polylactic acid (PLA) or other bioplastics is ideal; in the construction sector, bio-adhesives go well with bio-based paints and insulating materials. In addition to market data and forecasts, the bio-based adhesives market report by Ceresana also contains background information on the general economic situation and the situation in the construction industry in the individual countries.
The Current Bio-Based Adhesives Market Report by Ceresana:
Chapter 1 of the new market study “Biobased Adhesives – World (2nd Edition)” provides a comprehensive presentation and analysis of the global market for biobased adhesives with forecasts up to 2034: For the world regions Western Europe, Eastern Europe, North America, South America, Asia-Pacific, Middle East, and Africa, the development of demand (tonnes) and revenue (dollars and euros) is shown. In addition, revenues and demand are broken down by the application areas paper/packaging, construction industry, wood processing, and other applications.
In Chapter 2, the 17 countries with the largest national markets for bioadhesives are examined individually: Germany, France, Italy, Spain, United Kingdom, Poland, Russia, Türkiye, Canada, Mexico, USA, Brazil, China, India, Japan, South Korea, and Taiwan. The demand for and revenues generated with bio-based adhesives are shown in each case.
In addition, demand and revenues are further broken down by the following adhesive application areas:
- Paper/packaging
- Construction industry
- Wood processing
- Other applications
Chapter 3 provides useful company profiles of the largest bio-based adhesive manufacturers, clearly arranged according to contact details, revenues, net income, product range, production sites, and profile summary. Detailed profiles of 34 manufacturers are provided, including Cargill, Inc., Stora Enso Oyj, H.B. Fuller Co., Solenis LLC, Soudal Group, Kerakoll SpA, Royal Avebe, Artivion, Inc., and artience Co., Ltd.
=> Ceresana regularly analyzes the European and global markets for adhesives. Current Ceresana market studies are available on various application areas for adhesives, such as insulation materials, labels, and packaging materials such as corrugated board or cardboard. Ceresana also analyzes the markets for various components of adhesives, such as individual types of polymers, solvents, fillers, and flame retardants. Bio-based materials are a particular focus of Ceresana’s market research.
Scope of the Report:
Attributes | Details |
Base Year | 2024 |
Trend Period | 2022 – 2034 |
Forecast Period | 2025 – 2034 |
Pages | 240 |
Application Areas | Paper/packaging, construction industry, wood processing, other applications |
Company Profiles | Cargill, Stora Enso, H.B. Fuller, Solenis, Soudal, Kerakoll, Royal Avebe, Artivion, and artience (selection) |
Edition | 2nd edition |
Publication | June 2025 |
FAQs
How will global revenues generated with biobased adhesives develop until 2034?
Ceresana’s market report predicts that adhesives made, at least in part, from renewable raw materials will grow significantly and global revenues will reach around USD 4.5 billion by 2034.
How will the market for biobased adhesives develop over the next 10 years?
Ceresana expects annual growth of more than 4% in Asia, Africa and the Middle East, and just over 3% in Europe and North America.
Which application area generated the highest revenues with biobased adhesives?
In 2024, the paper and packaging application area accounted for almost a third of the revenues generated worldwide with biobased adhesives.
1 Market Data: World and Regions
1.1 Basics
1.1.1 Overview of Biobased Raw Materials
1.1.2 Eco-Labels and Environmental Information
1.2 World
1.2.1 Demand
1.2.2 Revenues
1.2.3 Demand Split by Application Area
1.2.3.1 Paper/Packaging
1.2.3.2 Construction Industry
1.2.3.3 Wood Processing
1.2.3.4 Other Applications
1.2.4 Revenues Split by Application Area
1.2.4.1 Paper/Packaging
1.2.4.2 Construction Industry
1.2.4.3 Wood Processing
1.2.4.4 Other Applications
1.3 Western Europe
1.3.1 Demand
1.3.2 Revenues
1.3.3 Applications
1.4 Eastern Europe
1.4.1 Demand
1.4.2 Revenues
1.4.3 Applications
1.5 North America
1.5.1 Demand
1.5.2 Revenues
1.5.3 Applications
1.6 South America
1.6.1 Demand
1.6.2 Revenues
1.6.3 Applications
1.7 Asia-Pacific
1.7.1 Demand
1.7.2 Revenues
1.7.3 Applications
1.8 Middle East
1.8.1 Demand
1.8.2 Revenues
1.8.3 Applications
1.9 Africa
1.9.1 Demand
1.9.2 Revenues
1.9.3 Applications
2 Market Data: Countries
2.1 Western Europe
2.1.1 France
2.1.2 Germany
2.1.3 Italy
2.1.4 Spain
2.1.5 United Kingdom
2.1.6 Other Western Europe
2.2 Eastern Europe
2.2.1 Poland
2.2.2 Russia
2.2.3 Türkiye
2.2.4 Other Eastern Europe
2.3 North America
2.3.1 Canada
2.3.2 Mexico
2.3.3 USA
2.4 South America
2.4.1 Brazil
2.4.2 Other South America
2.5 Asia-Pacific
2.5.1 China
2.5.2 India
2.5.3 Japan
2.5.4 South Korea
2.5.5 Taiwan
2.5.6 Other Asia-Pacific
3 Company Profiles*
3.1 Western Europe
Belgium (1 Producer)
Finland (1)
France (1)
Germany (1)
Italy (4)
Spain (1)
Switzerland (1)
The Netherlands (2)
United Kingdom (2)
3.2 North America
Canada (1)
USA (10)
3.3 Asia-Pacific
India (4)
Japan (1)
Taiwan (3)
Thailand (1)
*Note: The profiles are assigned to the country in which the company or holding is headquartered. Profiles also include JVs and subsidiaries
Graph 1: Global demand from 2022 to 2034
Graph 2: Global demand from 2022 to 2034 – split by region
Graph 3: Global revenues from 2022 to 2034 in million USD and million EUR
Graph 4: Global revenues from 2022 to 2034 in million USD – split by region
Graph 5: Global revenues from 2022 to 2034 in million EUR – split by region
Graph 6: Global demand from 2022 to 2034 – split by application
Graph 7: Global demand in the “paper/packaging” segment from 2022 to 2034 – split by region
Graph 8: Global demand in the “construction industry” segment from 2022 to 2034 – split by region
Graph 9: Global demand in the “wood processing” segment from 2022 to 2034 – split by region
Graph 10: Global demand in the “other applications” segment from 2022 to 2034 – split by region
Graph 11: Demand in Western Europe from 2022 to 2034
Graph 12: Revenues generated in Western Europe from 2022 to 2034, in million USD and million EUR
Graph 13: Demand in Western Europe from 2022 to 2034 – split by application
Graph 14: Demand in Eastern Europe from 2022 to 2034
Graph 15: Revenues generated in Eastern Europe from 2022 to 2034, in million USD and million EUR
Graph 16: Demand in Eastern Europe from 2022 to 2034 – split by application
Graph 17: Demand in North America from 2022 to 2034
Graph 18: Revenues generated in North America from 2022 to 2034, in million USD and million EUR
Graph 19: Demand in North America from 2022 to 2034 – split by application
Graph 20: Demand in South America from 2022 to 2034
Graph 21: Revenues generated in South America from 2022 to 2034, in million USD and million EUR
Graph 22: Demand in South America from 2022 to 2034 – split by application
Graph 23: Demand in Asia-Pacific from 2022 to 2034
Graph 24: Revenues generated in Asia-Pacific from 2022 to 2034, in million USD and million EUR
Graph 25: Demand in Asia-Pacific from 2022 to 2034 – split by application
Graph 26: Demand in the Middle East from 2022 to 2034
Graph 27: Revenues generated in the Middle East from 2022 to 2034, in million USD and million EUR
Graph 28: Demand in the Middle East from 2022 to 2034 – split by application
Graph 29: Demand in Africa from 2022 to 2034
Graph 30: Revenues generated in Africa from 2022 to 2034, in million USD and million EUR
Graph 31: Demand in Africa from 2022 to 2034 – split by application
Graph 32: Demand in France from 2022 to 2034
Graph 33: Demand in Germany from 2022 to 2034
Graph 34: Demand in Italy from 2022 to 2034
Graph 35: Demand in Spain from 2022 to 2034
Graph 36: Demand in the United Kingdom from 2022 to 2034
Graph 37: Demand in Other Western Europe from 2022 to 2034
Graph 38: Demand in Poland from 2022 to 2034
Graph 39: Demand in Russia from 2022 to 2034
Graph 40: Demand in Türkiye from 2022 to 2034
Graph 41: Demand in Other Eastern Europe from 2022 to 2034
Graph 42: Demand in Canada from 2022 to 2034
Graph 43: Demand in Mexico from 2022 to 2034
Graph 44: Demand in the USA from 2022 to 2034
Graph 45: Demand in Brazil from 2022 to 2034
Graph 46: Demand in Other South America from 2022 to 2034
Graph 47: Demand in China from 2022 to 2034
Graph 48: Demand in India from 2022 to 2034
Graph 49: Demand in Japan from 2022 to 2034
Graph 50: Demand in South Korea from 2022 to 2034
Graph 51: Demand in Taiwan from 2022 to 2034
Graph 52: Demand in Other Asia-Pacific from 2022 to 2034
Table 1: Global demand from 2022 to 2034 – split by region
Table 2: Global revenues from 2022 to 2034 in million USD – split by region
Table 3: Global revenues from 2022 to 2034 in million EUR – split by region
Table 4: Global demand from 2022 to 2034 – split by application
Table 5: Global demand in the “paper/packaging” segment from 2022 to 2034 – split by region
Table 6: Global demand in the “construction industry” segment from 2022 to 2034 – split by region
Table 7: Global demand in the “wood processing” segment from 2022 to 2034 – split by region
Table 8: Global demand in the “other applications” segment from 2022 to 2034 – split by region
Table 9: Global revenues from 2022 to 2034 – split by application
Table 10: Global revenues generated in the “paper/packaging” segment from 2022 to 2034 – split by region
Table 11: Global revenues generated in the “construction industry” segment from 2022 to 2034 – split by region
Table 12: Global revenues generated in the “wood processing” segment from 2022 to 2034 – split by region
Table 13: Global revenues generated in the “other applications” segment from 2022 to 2034 – split by region
Table 14: Demand in Western Europe from 2022 to 2034 – split by major country
Table 15: Revenues generated in Western Europe from 2022 to 2034, in million USD and million EUR
Table 16: Revenues generated in Western Europe from 2022 to 2034 – split by application
Table 17: Demand in Western Europe from 2022 to 2034 – split by application
Table 18: Demand in Eastern Europe from 2022 to 2034 – split by major country
Table 19: Revenues generated in Eastern Europe from 2022 to 2034, in million USD and million EUR
Table 20: Revenues generated in Eastern Europe from 2022 to 2034 – split by application
Table 21: Demand in Eastern Europe from 2022 to 2034 – split by application
Table 22: Demand in North America from 2022 to 2034 – split by major country
Table 23: Revenues generated in North America from 2022 to 2034, in million USD and million EUR
Table 24: Revenues generated in North America from 2022 to 2034 – split by application
Table 25: Demand in North America from 2022 to 2034 – split by application
Table 26: Demand in South America from 2022 to 2034 – split by major country
Table 27: Revenues generated in South America from 2022 to 2034, in million USD and million EUR
Table 28: Revenues generated in South America from 2022 to 2034 – split by application
Table 29: Demand in South America from 2022 to 2034 – split by application
Table 30: Demand in Asia-Pacific from 2022 to 2034 – split by major country
Table 31: Revenues generated in Asia-Pacific from 2022 to 2034, in million USD and million EUR
Table 32: Revenues generated in Asia-Pacific from 2022 to 2034 – split by application
Table 33: Demand in Asia-Pacific from 2022 to 2034 – split by application
Table 34: Revenues generated in the Middle East from 2022 to 2034, in million USD and million EUR
Table 35: Revenues generated in the Middle East from 2022 to 2034 – split by application
Table 36: Demand in the Middle East from 2022 to 2034 – split by application
Table 37: Revenues generated in Africa from 2022 to 2034, in million USD and million EUR
Table 38: Revenues generated in Africa from 2022 to 2034 – split by application
Table 39: Demand in Africa from 2022 to 2034 – split by application
Table 40: Revenues generated in France from 2022 to 2034, in million USD and million EUR
Table 41: Revenues generated in France from 2022 to 2034 – split by application
Table 42: Demand in France from 2022 to 2034 – split by application
Table 43: Revenues generated in Germany from 2022 to 2034, in million USD and million EUR
Table 44: Revenues generated in Germany from 2022 to 2034 – split by application
Table 45: Demand in Germany from 2022 to 2034 – split by application
Table 46: Revenues generated in Italy from 2022 to 2034, in million USD and million EUR
Table 47: Revenues generated in Italy from 2022 to 2034 – split by application
Table 48: Demand in Italy from 2022 to 2034 – split by application
Table 49: Revenues generated in Spain from 2022 to 2034, in million USD and million EUR
Table 50: Revenues generated in Spain from 2022 to 2034 – split by application
Table 51: Demand in Spain from 2022 to 2034 – split by application
Table 52: Revenues generated in the United Kingdom from 2022 to 2034, in million USD and million EUR
Table 53: Revenues generated in the United Kingdom from 2022 to 2034 – split by application
Table 54: Demand in the United Kingdom from 2022 to 2034 – split by application
Table 55: Revenues generated in Other Western Europe from 2022 to 2034, in million USD and million EUR
Table 56: Revenues generated in Other Western Europe from 2022 to 2034 – split by application
Table 57: Demand in Other Western Europe from 2022 to 2034 – split by application
Table 58: Revenues generated in Poland from 2022 to 2034, in million USD and million EUR
Table 59: Revenues generated in Poland from 2022 to 2034 – split by application
Table 60: Demand in Poland from 2022 to 2034 – split by application
Table 61: Revenues generated in Russia from 2022 to 2034, in million USD and million EUR
Table 62: Revenues generated in Russia from 2022 to 2034 – split by application
Table 63: Demand in Russia from 2022 to 2034 – split by application
Table 64: Revenues generated in Türkiye from 2022 to 2034, in million USD and million EUR
Table 65: Revenues generated in Türkiye from 2022 to 2034 – split by application
Table 66: Demand in Türkiye from 2022 to 2034 – split by application
Table 67: Revenues generated in Other Eastern Europe from 2022 to 2034, in million USD and million EUR
Table 68: Revenues generated in Other Eastern Europe from 2022 to 2034 – split by application
Table 69: Demand in Other Eastern Europe from 2022 to 2034 – split by application
Table 70: Revenues generated in Canada from 2022 to 2034, in million USD and million EUR
Table 71: Revenues generated in Canada from 2022 to 2034 – split by application
Table 72: Demand in Canada from 2022 to 2034 – split by application
Table 73: Revenues generated in Mexico from 2022 to 2034, in million USD and million EUR
Table 74: Revenues generated in Mexico from 2022 to 2034 – split by application
Table 75: Demand in Mexico from 2022 to 2034 – split by application
Table 76: Revenues generated in the USA from 2022 to 2034, in million USD and million EUR
Table 77: Revenues generated in the USA from 2022 to 2034 – split by application
Table 78: Demand in the USA from 2022 to 2034 – split by application
Table 79: Revenues generated in Brazil from 2022 to 2034, in million USD and million EUR
Table 80: Revenues generated in Brazil from 2022 to 2034 – split by application
Table 81: Demand in Brazil from 2022 to 2034 – split by application
Table 82: Revenues generated in Other South America from 2022 to 2034, in million USD and million EUR
Table 83: Revenues generated in Other South America from 2022 to 2034 – split by application
Table 84: Demand in Other South America from 2022 to 2034 – split by application
Table 85: Revenues generated in China from 2022 to 2034, in million USD and million EUR
Table 86: Revenues generated in China from 2022 to 2034 – split by application
Table 87: Demand in China from 2022 to 2034 – split by application
Table 88: Revenues generated in India from 2022 to 2034, in million USD and million EUR
Table 89: Revenues generated in India from 2022 to 2034 – split by application
Table 90: Demand in India from 2022 to 2034 – split by application
Table 91: Revenues generated in Japan from 2022 to 2034, in million USD and million EUR
Table 92: Revenues generated in Japan from 2022 to 2034 – split by application
Table 93: Demand in Japan from 2022 to 2034 – split by application
Table 94: Revenues generated in South Korea from 2022 to 2034, in million USD and million EUR
Table 95: Revenues generated in South Korea from 2022 to 2034 – split by application
Table 96: Demand in South Korea from 2022 to 2034 – split by application
Table 97: Revenues generated in Taiwan from 2022 to 2034, in million USD and million EUR
Table 98: Revenues generated in Taiwan from 2022 to 2034 – split by application
Table 99: Demand in Taiwan from 2022 to 2034 – split by application
Table 100: Revenues generated in Other Asia-Pacific from 2022 to 2034, in million USD and million EUR
Table 101: Revenues generated in Other Asia-Pacific from 2022 to 2034 – split by application
Table 102: Demand in Other Asia-Pacific from 2022 to 2034 – split by application


