

Description
The Bags, Sacks, and Pouches Market Report – Europe is now also available in parts (e.g. individual country profiles or all manufacturer profiles). Please feel free to contact us and we will immediately send you an offer for your specific selection.
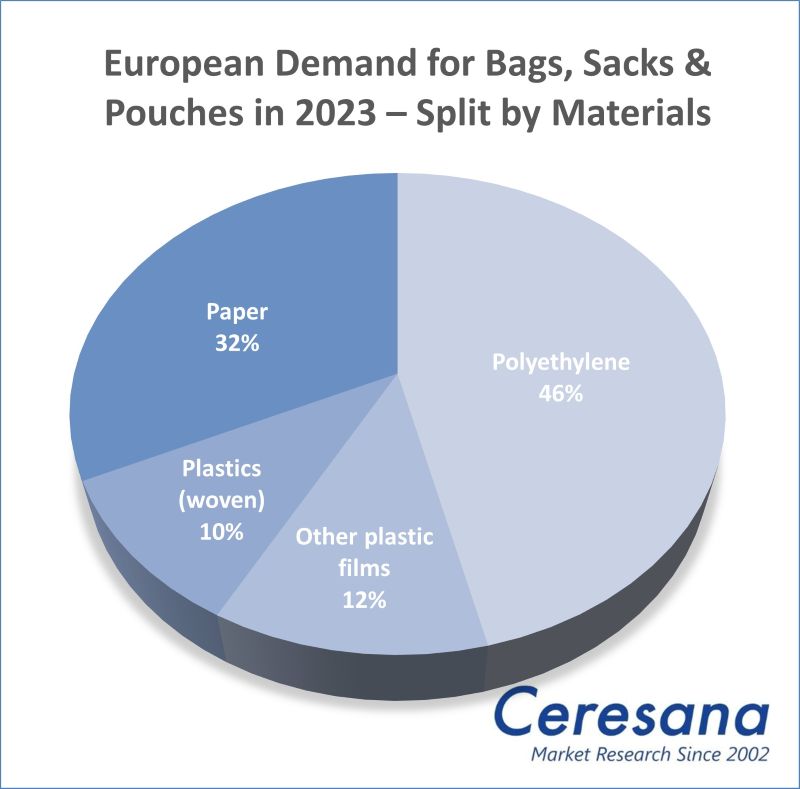
Europe is combating the use of single-use packaging: The new EU Packaging and Packaging Waste Regulation (PPWR) aims to reduce packaging waste by at least 15% by 2040. This is already having an impact on the demand for bags and sacks. The consumption of plastic carrier bags continues to decline; in many market segments, the trend is towards paper. Ceresana has now analyzed the entire European market for bags, sacks, and pouches made of polyethylene film, films made of other plastics, woven plastic strips (woven bags), and paper for the fifth time. In addition to market data, forecasts, and company profiles, the new market report also provides background information on the regulatory framework in the EU as well as the economic situation and the situation in the packaging and construction industry in the individual European countries. This includes information on market size, recycling rates, and major companies in the packaging industry.
Paper Instead of Polyethylene?
Many retail chains are now doing away with single-use plastic sacks and promoting reusable shopping bags. In supermarkets, loose fruit and vegetables are increasingly being packaged in small paper bags instead of thin plastic t-shirt bags. This is one reason for the declining consumption of bags, sacks, and pouches made of polyethylene (PE). In contrast, demand for pouch packaging made from other films is recording growth, for example because the plastic grades BOPP and BOPET have special properties. At the same time, the consumption of garbage bags is also increasing slightly because fewer and fewer plastic carrier bags are finding a second use as bin liners. However, market researchers at Ceresana expect the amount of household waste to fall in most European countries over the next few years – and with it the demand for waste bags made of paper or bioplastics.
Trend Towards Specialization and Customization
Around 7.8 million tonnes of bags are currently produced in Europe every year. Production is highest in Türkiye. Smart packaging, for example with sensors for temperature monitoring or interactive elements such as QR codes, artificial intelligence, digitalized production processes, and robotics are increasingly making it possible to tailor packaging to individual customer requirements, for example through flexible designs, small print runs, or target group-specific campaigns. In the context of the circular economy and bio-economy, recyclable, reusable, or bio-based packaging is becoming increasingly important. According to Ceresana’s market analysis, stand-up pouches continue to expand their market share: Food, hygiene, and personal care products, as well as pet food, are products that are increasingly being packaged in stand-up pouches. The demand for heavy-duty and industrial bags, such as big bags (FIBC: flexible intermediate bulk containers), is particularly dependent on the construction industry and the demand for building materials.
Current European Market Analysis “Bags, Sacks, and Pouches”:
Chapter 1 offers an overview of the European market for bags, sacks, and pouches, including growth forecasts until 2033. Data on production and demand volumes as well as on the individual material types and application areas are listed in clear tables and figures.
In chapter 2, production (split by plastics and paper), demand (split by polyethylene, other plastic films, woven plastics, and paper) as well as imports and exports (split by plastics and paper) are analyzed for 22 individual countries. In addition, detailed information on the demand for bags, sacks, and pouches is provided for the eight most important markets in Europe (Germany, France, Italy, Poland, Russia, Spain, Türkiye, United Kingdom) and broken down into individual application areas. The production of bags for these countries is broken down by material (polyethylene (LDPE, LLDPE, HDPE), other plastics, woven plastics, and paper).
These applications are examined in detail for plastics and paper:
Plastics:
- Carrier bags
- Garbage bags
- Heavy duty sacks and industrial sacks
- Pouch packaging for food:
- Frozen food
- Ready meals & soups
- Confectionary
- Savory snacks
- Baked goods
- Fresh fruit & vegetables
- Pasta, rice, and other foods
- Other applications
Paper:
- Carrier bags
- Heavy duty sacks and industrial sacks
- Pouch packaging for food:
- Baked goods
- Fresh fruit & vegetables
- Flour, sugar, and other food
- Other applications (incl. garbage bags)
In contrast, packaging made of cotton, jute, or other materials is not examined in this study.
Chapter 3 provides useful company profiles of the most important manufacturers of bags, sacks, and pouches in Europe, clearly arranged according to contact details, revenues, net income, product range, production sites, and profile summary, as well as product types and applications. Detailed profiles of 75 paper and plastic bag manufacturers are provided, such as Mondi Group, DS Smith plc, Mayr-Melnhof Karton AG, Wihuri Group, Melitta Group Management GmbH & Co. KG, SIG Group, Amcor plc, and Grupo Armando Alvarez, S.A.
=> Ceresana regularly analyzes the European and global packaging market. Current Ceresana market studies are available on various packaging materials, such as corrugated board and cardboard, plastic films, plastic closures, plastic containers, as well as flexible and rigid packaging made of metal or plastic. Market analyses of labels, adhesives, and printing inks are also relevant for the packaging industry. Special market studies by Ceresana analyze food packaging as well as packaging for cosmetics and personal care products. Bio-based materials are a particular focus of Ceresana’s market research.
Scope of the Report:
Attributes | Details |
| Base Year | 2023 |
| Trend Period | 2021 – 2033 |
| Forecast Period | 2024 – 2033 |
| Pages | 370 |
| Materials | Polyethylene (LDPE, LLDPE, HDPE), other plastics, woven plastics, paper |
| Applications – Plastic | Carrier bags, garbage bags, heavy duty sacks and industrial sacks, pouch packaging for food (frozen food, ready meals & soups, confectionary, savory snacks, baked goods, fresh fruit & vegetables, pasta, rice, and other foods), and others |
| Applications – Paper | Carrier bags, heavy duty sacks and industrial sacks, pouch packaging for food (baked goods, fresh fruit & vegetables, and flour, sugar, and other food), and others (incl. garbage bags) |
| Company Profiles | Mondi, DS Smith, Mayr-Melnhof, Wihuri, Melitta, SIG, Amcor, and Armando Alvarez (Selection) |
| Edition | 5th edition |
| Publication | July 2025 |
FAQs
From which material are bags and sacks mainly made?
Polyethylene is by far the most widely used material in the production of bags, sacks, and pouches.
Which factors affect the dynamics of the market for single-use plastic sacks?
Many retail chains are now doing away with single-use plastic sacks and promoting reusable shopping bags. In supermarkets, loose fruit and vegetables are increasingly being packaged in small paper bags instead of thin plastic t-shirt bags.
How big is the European production of bags, sacks, and pouches?
Around 7.8 million tonnes of bags are currently produced in Europe every year.
1 Market Data
1.1 Demand
1.2 Production
1.3 Demand Split by Application Area – Plastics
1.3.1 Carrier Bags – Plastics
1.3.2 Garbage Bags – Plastics
1.3.3 Heavy Duty & Industry – Plastics
1.3.4 Food Packaging – Plastics
1.3.4.1 Frozen Food
1.3.4.2 Ready Meals & Soups
1.3.4.3 Confectionary
1.3.4.4 Savory Snacks
1.3.4.5 Baked Goods
1.3.4.6 Fresh Fruit & Vegetables
1.3.4.7 Pasta, Rice & Other Food
1.3.5 Other Applications – Plastics
1.4 Demand Split by Application Area – Paper
1.4.1 Carrier Bags – Paper
1.4.2 Heavy Duty & Industry – Paper
1.4.3 Food Packaging – Paper
1.4.3.1 Baked Goods
1.4.3.2 Fresh Fruit & Vegetables
1.4.3.3 Flour, Sugar & Other Food
1.4.4 Other Applications – Paper
1.5 Demand Split by Material
1.5.1 Polyethylene
1.5.2 Other Plastics (Films)
1.5.3 Plastics (Woven)
1.5.4 Paper
1.6 Production Split by Material
1.6.1 LDPE
1.6.2 LLDPE
1.6.3 HDPE
1.6.4 Other Plastics (Films)
1.6.5 Plastics (Woven)
1.6.6 Paper
1.7 Excursus: Regulations and Directives in the European Union (EU)
1.7.1 General Information
1.7.2 Packaging
2 Market Data: Countries
2.1 Austria
2.1.1 Demand
2.1.2 Production and Trade
2.2 Belgium
2.2.1 Demand
2.2.2 Production and Trade
2.3 Czechia
2.3.1 Demand
2.3.2 Production and Trade
2.4 Denmark
2.4.1 Demand
2.4.2 Production and Trade
2.5 Finland
2.5.1 Demand
2.5.2 Production and Trade
2.6 France
2.6.1 Demand
2.6.2 Production and Trade
2.7 Germany
2.7.1 Demand
2.7.2 Production and Trade
2.8 Greece
2.8.1 Demand
2.8.2 Production and Trade
2.9 Hungary
2.9.1 Demand
2.9.2 Production and Trade
2.10 Italy
2.10.1 Demand
2.10.2 Production and Trade
2.11 Norway
2.11.1 Demand
2.11.2 Production and Trade
2.12 Poland
2.12.1 Demand
2.12.2 Production and Trade
2.13 Portugal
2.13.1 Demand
2.13.2 Production and Trade
2.14 Romania
2.14.1 Demand
2.14.2 Production and Trade
2.15 Russia
2.15.1 Demand
2.15.2 Production and Trade
2.16 Slovakia
2.16.1 Demand
2.16.2 Production and Trade
2.17 Slovenia
2.17.1 Demand
2.17.2 Production and Trade
2.18 Spain
2.18.1 Demand
2.18.2 Production and Trade
2.19 Sweden
2.19.1 Demand
2.19.2 Production and Trade
2.20 The Netherlands
2.20.1 Demand
2.20.2 Production and Trade
2.21 Türkiye
2.21.1 Demand
2.21.2 Production and Trade
2.23 United Kingdom
2.23.1 Demand
2.23.2 Production and Trade
2.24 Rest of Europe
2.24.1 Demand
2.24.2 Production and Trade
3 Company Profiles*
Austria (3 Producers)
Belarus (1)
Belgium (3)
Bosnia and Herzegovina (1)
Bulgaria (1)
Croatia (1)
Czechia (3)
Denmark (1)
Finland (5)
France (7)
Germany (7)
Greece (1)
Ireland (2)
Italy (7)
Norway (1)
Poland (3)
Portugal (1)
Romania (1)
Spain (3)
Sweden (2)
Switzerland (5)
The Netherlands (5)
Türkiye (5)
Ukraine (1)
United Kingdom (5)
*Note: The profiles are assigned to the country in which the company or holding is headquartered. Profiles also include JVs and subsidiaries.
Graph 1: Demand in Europe from 2021 to 2033
Graph 2: Production in Europe from 2021 to 2033
Graph 21: Demand in Austria from 2021 to 2033
Graph 22: Production in Austria from 2021 to 2033
Graph 3: Demand in Belgium from 2021 to 2033
Graph 4: Production in Belgium from 2021 to 2033
Graph 39: Demand in Czechia from 2021 to 2033
Graph 40: Production in Czechia from 2021 to 2033
Graph 5: Demand in Denmark from 2021 to 2033
Graph 6: Production in Denmark from 2021 to 2033
Graph 9: Demand in Finland from 2021 to 2033
Graph 10: Production in Finland from 2021 to 2033
Graph 11: Demand in France from 2021 to 2033
Graph 12: Production in France from 2021 to 2033
Graph 7: Demand in Germany from 2021 to 2033
Graph 8: Production in Germany from 2021 to 2033
Graph 13: Demand in Greece from 2021 to 2033
Graph 14: Production in Greece from 2021 to 2033
Graph 43: Demand in Hungary from 2021 to 2033
Graph 44: Production in Hungary from 2021 to 2033
Graph 15: Demand in Italy from 2021 to 2033
Graph 16: Production in Italy from 2021 to 2033
Graph 19: Demand in Norway from 2021 to 2033
Graph 20: Production in Norway from 2021 to 2033
Graph 23: Demand in Poland from 2021 to 2033
Graph 24: Production in Poland from 2021 to 2033
Graph 25: Demand in Portugal from 2021 to 2033
Graph 26: Production in Portugal from 2021 to 2033
Graph 27: Demand in Romania from 2021 to 2033
Graph 28: Production in Romania from 2021 to 2033
Graph 29: Demand in Russia from 2021 to 2033
Graph 30: Production in Russia from 2021 to 2033
Graph 33: Demand in Slovakia from 2021 to 2033
Graph 34: Production in Slovakia from 2021 to 2033
Graph 35: Demand in Slovenia from 2021 to 2033
Graph 36: Production in Slovenia from 2021 to 2033
Graph 37: Demand in Spain from 2021 to 2033
Graph 38: Production in Spain from 2021 to 2033
Graph 31: Demand in Sweden from 2021 to 2033
Graph 32: Production in Sweden from 2021 to 2033
Graph 17: Demand in the Netherlands from 2021 to 2033
Graph 18: Production in the Netherlands from 2021 to 2033
Graph 41: Demand in Türkiye from 2021 to 2033
Graph 42: Production in Türkiye from 2021 to 2033
Graph 45: Demand in the United Kingdom from 2021 to 2033
Graph 46: Production in the United Kingdom from 2021 to 2033
Graph 47: Demand in the rest of Europe from 2021 to 2033
Graph 48: Production in the rest of Europe from 2021 to 2033
Table 1: Demand in Europe from 2021 to 2033 – split by country
Table 2: Production in Europe from 2021 to 2033 – split by country
Table 3: Demand in Europe from 2021 to 2033 – split by application – plastics
Table 4: Demand in Europe in the “carrier bags – plastics” segment from 2021 to 2033 – split by country
Table5: Demand in Europe in the “garbage bags – plastics” segment from 2021 to 2033 – split by country
Table 6: Demand in Europe in the “heavy duty & industry – plastics” segment from 2021 to 2033 – split by country
Table 7: Demand in Europe in the “food packaging – plastics” segment from 2021 to 2033 – split by country
Table 8: Demand in Europe in the “frozen food – plastics” segment from 2021 to 2033 – split by country
Table 9: Demand in Europe in the “ready meals & soups – plastics” segment from 2021 to 2033 – split by country
Table 10: Demand in Europe in the “confectionary – plastics” segment from 2021 to 2033 – split by country
Table 11: Demand in Europe in the “savory snacks – plastics” segment from 2021 to 2033 – split by country
Table 12: Demand in Europe in the “baked goods – plastics” segment from 2021 to 2033 – split by country
Table 13: Demand in Europe in the “fresh fruit & vegetables – plastics” segment from 2021 to 2033 – split by country
Table 14: Demand in Europe in the “pasta, rice & other food – plastics” segment from 2021 to 2033 – split by country
Table 15: Demand in Europe in the “other applications – plastics” segment from 2021 to 2033 – split by country
Table 16: Demand in Europe from 2021 to 2033 – split by application – paper
Table 17: Demand in Europe in the “carrier bags – paper” segment from 2021 to 2033 – split by country
Table 18: Demand in Europe in the “heavy duty & industry – paper” segment from 2021 to 2033 – split by country
Table 19: Demand in Europe in the “food packaging – paper” segment from 2021 to 2033 – split by country
Table 20: Demand in Europe in the “baked goods – paper” segment from 2021 to 2033 – split by country
Table 21: Demand in Europe in the “fresh fruit & vegetables – paper” segment from 2021 to 2033 – split by country
Table 22: Demand in Europe in the “flour, sugar & other food – paper” segment from 2021 to 2033 – split by country
Table 23: Demand in Europe in the “other applications – paper” segment from 2021 to 2033 – split by country
Table 24: Demand in Europe from 2021 to 2033 – split by material
Table 25: Demand for bags, sacks, and pouches made of “polyethylene” in Europe from 2021 to 2033 – split by country
Table 26: Demand for bags, sacks, and pouches made of “other plastics (films)” in Europe from 2021 to 2033 – split by country
Table 27: Demand for bags, sacks, and pouches made of “plastics (woven)” in Europe from 2021 to 2033 – split by country
Table 28: Demand for bags, sacks, and pouches made of “paper” in Europe from 2021 to 2033 – split by country
Table 29: Production in Europe from 2021 to 2033 – split by material
Table 30: Production of bags, sacks, and pouches made of “LDPE” in Europe from 2021 to 2033 – split by country
Table 31: Production of bags, sacks, and pouches made of “LLDPE” in Europe from 2021 to 2033 – split by country
Table 32: Production of bags, sacks, and pouches made of “HDPE” in Europe from 2021 to 2033 – split by country
Table 33: Production of bags, sacks, and pouches made of “other plastics (films)” in Europe from 2021 to 2033 – split by country
Table 34: Production of bags, sacks, and pouches made of “plastics (woven)” in Europe from 2021 to 2033 – split by country
Table 35: Production of bags, sacks, and pouches made of “paper” in Europe from 2021 to 2033 – split by country
Table 78: Demand in Austria from 2021 to 2033 – split by material
Table 79: Production, import, export, and demand in Austria from 2021 to 2033
Table 80: Production in Austria from 2021 to 2033 – split by material
Table 81: Import and export in Austria from 2021 to 2033 – split by material
Table 36: Demand in Belgium from 2021 to 2033 – split by material
Table 37: Production, import, export, and demand in Belgium from 2021 to 2033
Table 38: Production in Belgium from 2021 to 2033 – split by material
Table39: Import and export in Belgium from 2021 to 2033 – split by material
Table 120: Demand in Czechia from 2021 to 2033 – split by material
Table 121: Production, import, export, and demand in Czechia from 2021 to 2033
Table 122: Production in Czechia from 2021 to 2033 – split by material
Table 123: Import and export in Czechia from 2021 to 2033 – split by material
Table 40: Demand in Denmark from 2021 to 2033 – split by material
Table 41: Production, import, export, and demand in Denmark from 2021 to 2033
Table 42: Production in Denmark from 2021 to 2033 – split by material
Table 43: Import and export in Denmark from 2021 to 2033 – split by material
Table 50: Demand in Finland from 2021 to 2033 – split by material
Table 51: Production, import, export, and demand in Finland from 2021 to 2033
Table 52: Production in Finland from 2021 to 2033 – split by material
Table 53: Import and export in Finland from 2021 to 2033 – split by material
Table 54: Demand for plastic bags, sacks, and pouches in France from 2021 to 2033 – split by application
Table 55: Demand for paper bags, sacks, and pouches in France from 2021 to 2033 – split by application
Table 56: Demand in France from 2021 to 2033 – split by material
Table 57: Production, import, export, and demand in France from 2021 to 2033
Table 58: Production in France from 2021 to 2033 – split by material
Table 59: Import and export in France from 2021 to 2033 – split by material
Table 44: Demand for plastic bags, sacks, and pouches in Germany from 2021 to 2033 – split by application
Table 45: Demand for paper bags, sacks, and pouches in Germany from 2021 to 2033 – split by application
Table 46: Demand in Germany from 2021 to 2033 – split by material
Table 47: Production, import, export, and demand in Germany from 2021 to 2033
Table 48: Production in Germany from 2021 to 2033 – split by material
Table 49: Import and export in Germany from 2021 to 2033 – split by material
Table 60: Demand in Greece from 2021 to 2033 – split by material
Table 61: Production, import, export, and demand in Greece from 2021 to 2033
Table 62: Production in Greece from 2021 to 2033 – split by material
Table 63: Import and export in Greece from 2021 to 2033 – split by material
Table 130: Demand in Hungary from 2021 to 2033 – split by material
Table 131: Production, import, export, and demand in Hungary from 2021 to 2033
Table 132: Production in Hungary from 2021 to 2033 – split by material
Table 133: Import and export in Hungary from 2021 to 2033 – split by material
Table 64: Demand for plastic bags, sacks, and pouches in Italy from 2021 to 2033 – split by application
Table 65: Demand for paper bags, sacks, and pouches in Italy from 2021 to 2033 – split by application
Table 66: Demand in Italy from 2021 to 2033 – split by material
Table 67: Production, import, export, and demand in Italy from 2021 to 2033
Table 68: Production in Italy from 2021 to 2033 – split by material
Table 69: Import and export in Italy from 2021 to 2033 – split by material
Table 74: Demand in Norway from 2021 to 2033 – split by material
Table 75: Production, import, export, and demand in Norway from 2021 to 2033
Table 76: Production in Norway from 2021 to 2033 – split by material
Table 77: Import and export in Norway from 2021 to 2033 – split by material
Table 82: Demand for plastic bags, sacks, and pouches in Poland from 2021 to 2033 – split by application
Table 83: Demand for paper bags, sacks, and pouches in Poland from 2021 to 2033 – split by application
Table 84: Demand in Poland from 2021 to 2033 – split by material
Table 85: Production, import, export, and demand in Poland from 2021 to 2033
Table 86: Production in Poland from 2021 to 2033 – split by material
Table 87: Import and export in Poland from 2021 to 2033 – split by material
Table88: Demand in Portugal from 2021 to 2033 – split by material
Table89: Production, import, export, and demand in Portugal from 2021 to 2033
Table 90: Production in Portugal from 2021 to 2033 – split by material
Table 91: Import and export in Portugal from 2021 to 2033 – split by material
Table 92: Demand in Romania from 2021 to 2033 – split by material
Table 93: Production, import, export, and demand in Romania from 2021 to 2033
Table 94: Production in Romania from 2021 to 2033 – split by material
Table 95: Import and export in Romania from 2021 to 2033 – split by material
Table 96: Demand for plastic bags, sacks, and pouches in Russia from 2021 to 2033 – split by application
Table 97: Demand for paper bags, sacks, and pouches in Russia from 2021 to 2033 – split by application
Table 98: Demand in Russia from 2021 to 2033 – split by material
Table 99: Production, import, export, and demand in Russia from 2021 to 2033
Table 100: Production in Russia from 2021 to 2033 – split by material
Table 101: Import and export in Russia from 2021 to 2033 – split by material
Table 106: Demand in Slovakia from 2021 to 2033 – split by material
Table 107: Production, import, export, and demand in Slovakia from 2021 to 2033
Table 108: Production in Slovakia from 2021 to 2033 – split by material
Table 109: Import and export in Slovakia from 2021 to 2033 – split by material
Table 110: Demand in Slovenia from 2021 to 2033 – split by material
Table 111: Production, import, export, and demand in Slovenia from 2021 to 2033
Table 112: Production in Slovenia from 2021 to 2033 – split by material
Table 113: Import and export in Slovenia from 2021 to 2033 – split by material
Table 114: Demand for plastic bags, sacks, and pouches in Spain from 2021 to 2033 – split by application
Table 115: Demand for paper bags, sacks, and pouches in Spain from 2021 to 2033 – split by application
Table 116: Demand in Spain from 2021 to 2033 – split by material
Table 117: Production, import, export, and demand in Spain from 2021 to 2033
Table 118: Production in Spain from 2021 to 2033 – split by material
Table 119: Import and export in Spain from 2021 to 2033 – split by material
Table 102: Demand in Sweden from 2021 to 2033 – split by material
Table 103: Production, import, export, and demand in Sweden from 2021 to 2033
Table 104: Production in Sweden from 2021 to 2033 – split by material
Table 105: Import and export in Sweden from 2021 to 2033 – split by material
Table 70: Demand in the Netherlands from 2021 to 2033 – split by material
Table 71: Production, import, export, and demand in the Netherlands from 2021 to 2033
Table 72: Production in the Netherlands from 2021 to 2033 – split by material
Table 73: Import and export in the Netherlands from 2021 to 2033 – split by material
Table 124: Demand for plastic bags, sacks, and pouches in Türkiye from 2021 to 2033 – split by application
Table 125: Demand for paper bags, sacks, and pouches in Türkiye from 2021 to 2033 – split by application
Table126: Demand in Türkiye from 2021 to 2033 – split by material
Table127: Production, import, export, and demand in Türkiye from 2021 to 2033
Table 128: Production in Türkiye from 2021 to 2033 – split by material
Table 129: Import and export in Türkiye from 2021 to 2033 – split by material
Table 134: Demand for plastic bags, sacks, and pouches in the United Kingdom from 2021 to 2033 – split by application
Table 135: Demand for paper bags, sacks, and pouches in the United Kingdom from 2021 to 2033 – split by application
Table 136: Demand in the United Kingdom from 2021 to 2033 – split by material
Table 137: Production, import, export, and demand in the United Kingdom from 2021 to 2033
Table 138: Production in the United Kingdom from 2021 to 2033 – split by material
Table 139: Import and export in the United Kingdom from 2021 to 2033 – split by material
Table 140: Demand in the rest of Europe from 2021 to 2033 – split by material
Table 141: Production, import, export, and demand in the rest of Europe from 2021 to 2033
Table 142: Production in the rest of Europe from 2021 to 2033 – split by material
Table 143: Import and export in the rest of Europe from 2021 to 2033 – split by material


