

Description
The Adhesives Market Report – World is now also available in parts (e.g. individual country profiles or all manufacturer profiles). Please feel free to contact us and we will immediately send you an offer for your specific selection.
Vinyl is thriving! Although competition is becoming fiercer and adhesive technology is advancing rapidly, vinyl adhesives continue to lead the market in terms of demand. More than 14 million tonnes of adhesives are currently sold worldwide each year. Of this total, approximately 4.1 million tonnes are vinyl-based. Ceresana has now analyzed the global adhesives market for the seventh time: According to the market research institute, vinyl could see even further growth, particularly in packaging, consumer products, and simpler applications. However, the use of polyurethane, acrylic, and epoxy adhesives is currently growing even faster, at a rate of up to 3% per year.
The new edition of the adhesives market study provides key information on adhesives market size, demand, production, imports, and exports from 2022 onwards – and forecasts up to 2034. Volumes are stated in tonnes and revenues in both USD and EUR. This market report examines the following types of adhesives individually: vinyl, acrylic, polyurethane, elastomer, and epoxy adhesives, as well as other types of adhesives. The study does not cover sealants, cement, mortar, phenolic and other formaldehyde condensates.
Opportunities and Challenges for Adhesives
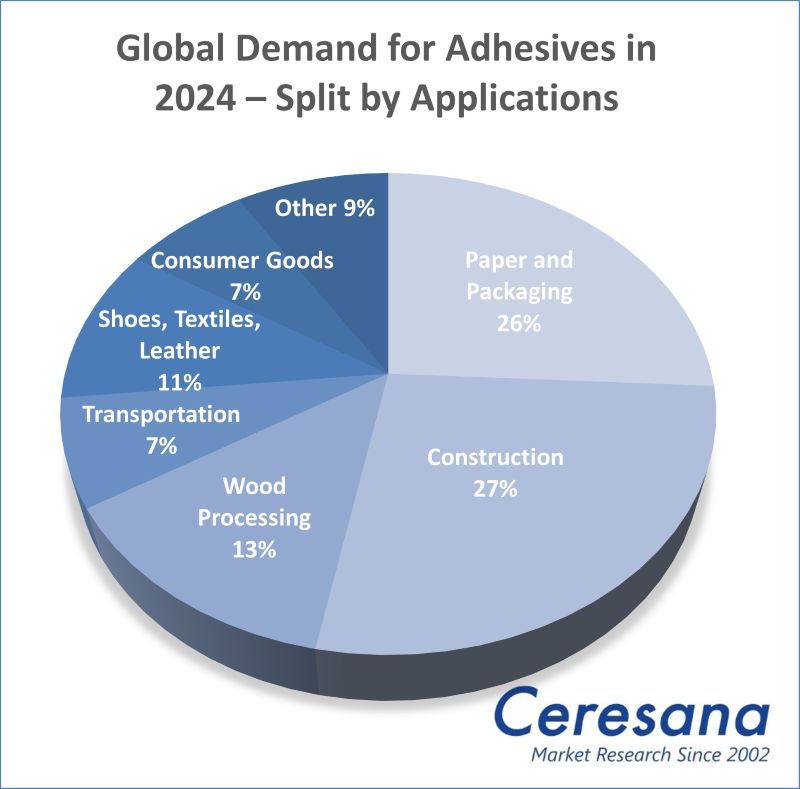
The construction industry is the world’s largest consumer of adhesive materials: Wall and floor coverings, cladding and panels, insulation materials, and other building products currently account for more than 27% of all adhesives used. However, the “shoes, textiles, and leather” sector is seeing the strongest growth in demand for adhesives, at around 3.1% per year: Particularly in Asia and Africa, the shift of production to emerging markets and the growth of the middle class are driving up demand for reactive PU adhesives in the fashion and apparel industry. In the automotive industry, lightweight car bodies and batteries for electromobility are increasing the demand for adhesives; thermosetting composites for wind turbine rotor blades are also bonded. By region, the Asia-Pacific region accounts for approximately 43% of global adhesive sales, followed by North America and Western Europe. In Europe, most adhesives are used in the “paper and packaging” segment. The main drivers of growth are e-commerce and the rising demand for transport and shipping packaging – while packaging manufacturers are increasingly succeeding in reducing material usage and improving efficiency. In addition to market data and forecasts, the global adhesives market report by Ceresana also contains background information on the regulatory framework in the EU as well as the general economic situation and the situation in the construction industry in the individual countries.
Market Data on Innovative Adhesive Trends
How about “Debonding on Demand”? For recycling and repairs, adhesives that can be removed precisely and without leaving any residue are practical. Nowadays, adhesives are tailor-made for a broad range of applications: There are already more than 250,000 different adhesive formulations, and the number is steadily increasing. In addition to adhesion and bonding, they also offer thermal and sound insulation, protection against moisture, electrical conductivity, pest control, and other innovative functions. The most important vinyl products are polyvinyl acetate (PVAC) and polyvinyl alcohol (PVA). They are followed by acrylic, polyurethane (PUR), elastomer, epoxy, and other adhesives. Polyurethane adhesives and reactive adhesives are currently experiencing the strongest growth. Water-based adhesives account for around 46% of total demand. Hot-melt adhesives are particularly in demand in applications where solvent-free products and fast processing are essential, such as in the furniture industry or in timber construction. There are still opportunities for solvent-based adhesives in specialty and niche applications: Despite increasingly stringent regulations on volatile organic compounds (VOCs), Ceresana expects growth of around 1.9% per year for these adhesive products.
Current Market Study “Adhesives – World” (7th Edition):
Chapter 1 provides an overview and analysis of the global adhesives market, including forecasts up to 2034: The development of revenues, demand volumes, and production is analyzed for each region. Regional adhesive markets are analyzed extensively:
Data and influencing factors on the use in the application areas:
- Construction
- Paper and packaging
- Wood processing
- Transportation
- Shoes, textiles, and leather
- Consumer goods
- Other applications.
Demand for adhesives is broken down by product type:
- Vinyl adhesives
- Acrylic adhesives
- Polyurethane (PUR) adhesives
- Elastomer adhesives
- Epoxy adhesives
- Other types of adhesives.
The various technologies are also covered individually:
- Water-based adhesives
- Hot-melt adhesives
- Solvent-based adhesives
- Reactive adhesives
- Other adhesive technologies.
Chapter 2 analyzes the global market for adhesives in the 17 most important countries: Global demand for, export and import of, as well as revenues generated with adhesives are given. In addition, these countries are also analyzed in detail regarding application area and adhesives technology. Revenues are broken down by application area. Market data on demand and production volume of each country is split for each type of adhesive.
Chapter 3 offers a useful directory of the 56 most important adhesive manufacturers, clearly arranged according to contact details, revenues, net income, product range, and production sites. The study features detailed company profiles of, for example, 3M Company, ALTANA AG, Bolton Group S.r.l., Compagnie de Saint-Gobain S.A., DuPont de Nemours, Inc., H.B. Fuller Co., Henkel AG & Co. KGaA, Nagase & Co., Ltd., Selena FM S.A., and Sika AG.
=> Ceresana regularly analyzes the global and European adhesive markets. In this context, specific market studies on bio-based adhesives and PUR adhesives are of particular interest. Current Ceresana market studies are also available on various application areas for adhesives, such as insulation materials, labels, and packaging materials such as corrugated board or cardboard. Ceresana also analyzes the markets for various components of adhesives, such as thermoplastic elastomers, solvents, surfactants, plasticizers, fillers, and flame retardants. Bio-based materials are a particular focus of Ceresana’s market research. Ceresana also organizes online events on the bio-economy, for example on investments in the bioeconomy, AI, and bioplastics.
Scope of the Report:
Attributes | Details |
| Base Year | 2024 |
| Trend Period | 2021 – 2034 |
| Forecast Period | 2025 – 2034 |
| Pages | 330 |
| Application Areas | Paper and packaging, construction, wood processing, transportation, shoes, textiles, and leather, consumer goods, and other applications |
| Product Types | Vinyl adhesives, acrylic adhesives, polyurethane adhesives, elastomer adhesives, epoxy adhesives, and other products |
| Technologies | Water-based adhesives, hot-melt adhesives, solvent-based adhesives, reactive adhesives, and other technologies |
| Company Profiles | 3M, ALTANA, Bolton, Saint-Gobain, DuPont, H.B. Fuller, Henkel, Nagase, Selena, and Sika. (Selection) |
| Edition | 7th edition |
| Publication | April 2026 |
FAQs
How big is the global adhesives market?
The current market size amounts to around 14 million tonnes of adhesives processed each year.
What are the key drivers of the adhesives market?
In Asia and Africa, the shift of production to emerging markets and the growth of the middle class are driving up demand for reactive PU adhesives in the fashion and apparel industry. In Europe, e-commerce and the growing demand for transport and shipping packaging are key drivers of growth for adhesives.
What are the most important regions for adhesives in 2022?
With a share of around 38.2% of global adhesives sales, Asia-Pacific is the largest adhesives market, followed by North America and Western Europe.
1 Market Data: World and Regions
1.1 World
1.1.1 Demand
1.1.2 Revenues
1.1.3 Production
1.1.4 Demand Split by Application Area
1.1.4.1 Paper and Packaging
1.1.4.2 Construction
1.1.4.3 Wood Processing
1.1.4.4 Transportation
1.1.4.5 Shoes, Textiles, and Leather
1.1.4.6 Consumer Goods
1.1.4.7 Other Applications
1.1.5 Revenues Split by Application Area
1.1.5.1 Paper and Packaging
1.1.5.2 Construction
1.1.5.3 Wood Processing
1.1.5.4 Transportation
1.1.5.5 Shoes, Textiles, and Leather
1.1.5.6 Consumer Goods
1.1.5.7 Other Applications
1.1.6 Demand Split by Product
1.1.6.1 Vinyl Adhesives
1.1.6.2 Acrylic Adhesives
1.1.6.3 Polyurethane Adhesives (PUR Adhesives)
1.1.6.4 Elastomer Adhesives
1.1.6.5 Epoxy Adhesives
1.1.6.6 Other Products
1.1.7 Demand Split by Technology
1.1.7.1 Water-Based Adhesives
1.1.7.2 Hot-Melt Adhesives
1.1.7.3 Solvent-Based Adhesives
1.1.7.4 Reactive Adhesives
1.1.7.5 Other Adhesive Technologies
1.1.8 Production Split by Product
1.1.8.1 Vinyl Adhesives
1.1.8.2 Acrylic Adhesives
1.1.8.3 Polyurethane Adhesives (PUR Adhesives)
1.1.8.4 Elastomer Adhesives
1.1.8.5 Epoxy Adhesives
1.1.8.6 Other Products
1.2 Western Europe
1.2.1 Demand
1.2.2 Revenues
1.2.3 Production
1.2.4 Applications and Products
1.3 Eastern Europe
1.3.1 Demand
1.3.2 Revenues
1.3.3 Production
1.3.4 Applications and Products
1.4 North America
1.4.1 Demand
1.4.2 Revenues
1.4.3 Production
1.4.4 Applications and Products
1.5 South America
1.5.1 Demand
1.5.2 Revenues
1.5.3 Production
1.5.4 Applications and Products
1.6 Asia-Pacific
1.6.1 Demand
1.6.2 Revenues
1.6.3 Production
1.6.4 Applications and Products
1.7 Middle East
1.7.1 Demand
1.7.2 Revenues
1.7.3 Production
1.7.4 Applications and Products
1.8 Africa
1.8.1 Demand
1.8.2 Revenues
1.8.3 Production
1.8.4 Applications and Products
1.9 Excursus: Regulations and Directives in the European Union (EU)
1.9.1 General Information
1.9.2 Construction Industry
2 Market Data: Countries
2.1 Western Europe
2.1.1 France
2.1.1.1 Demand and Revenues
2.1.1.2 Production and Trade
2.1.2 Germany
2.1.2.1 Demand and Revenues
2.1.2.2 Production and Trade
2.1.3 Italy
2.1.3.1 Demand and Revenues
2.1.3.2 Production and Trade
2.1.4 Spain
2.1.4.1 Demand and Revenues
2.1.4.2 Production and Trade
2.1.5 United Kingdom
2.1.5.1 Demand and Revenues
2.1.5.2 Production and Trade
2.1.6 Other Western Europe
2.1.6.1 Demand and Revenues
2.1.6.2 Production and Trade
2.2 Eastern Europe
2.2.1 Poland
2.2.1.1 Demand and Revenues
2.2.1.2 Production and Trade
2.2.2 Russia
2.2.2.1 Demand and Revenues
2.2.2.2 Production and Trade
2.2.3 Türkiye
2.2.3.1 Demand and Revenues
2.2.3.2 Production and Trade
2.2.4 Other Eastern Europe
2.2.4.1 Demand and Revenues
2.2.4.2 Production and Trade
2.3 North America
2.3.1 Canada
2.3.1.1 Demand and Revenues
2.3.1.2 Production and Trade
2.3.2 Mexico
2.3.2.1 Demand and Revenues
2.3.2.2 Production and Trade
2.3.3 USA
2.3.3.1 Demand and Revenues
2.3.3.2 Production and Trade
2.4 South America
2.4.1 Brazil
2.4.1.1 Demand and Revenues
2.4.1.2 Production and Trade
2.4.2 Other South America
2.4.2.1 Demand and Revenues
2.4.2.2 Production and Trade
2.5 Asia-Pacific
2.5.1 China
2.5.1.1 Demand and Revenues
2.5.1.2 Production and Trade
2.5.2 India
2.5.2.1 Demand and Revenues
2.5.2.2 Production and Trade
2.5.3 Japan
2.5.3.1 Demand and Revenues
2.5.3.2 Production and Trade
2.5.4 South Korea
2.5.4.1 Demand and Revenues
2.5.4.2 Production and Trade
2.5.5 Taiwan
2.5.5.1 Demand and Revenues
2.5.5.2 Production and Trade
2.5.6 Other Asia-Pacific
2.5.6.1 Demand and Revenues
2.5.6.2 Production and Trade
3 Company Profiles*
3.1 Western Europe
Belgium (2 Producers)
Finland (1)
France (2)
Germany (8)
Italy (2)
Sweden (1)
Switzerland (4)
The Netherlands (1)
United Kingdom (1)
3.2 Eastern Europe
Estonia (1)
Poland (1)
Slovakia (1)
Slovenia (1)
Türkiye (1)
3.3 North America
USA (10)
3.4 South America
Brazil (1)
3.5 Asia-Pacific
China (5)
India (1)
Japan (9)
Malaysia (1)
South Korea (1)
Taiwan (1)
*Note: The profiles are assigned to the country in which the company or holding is headquartered. Profiles also include JVs and subsidiaries.
Graph 1: Global demand from 2022 to 2034
Graph 2: Global demand from 2022 to 2034 – split by region
Graph 3: Global revenues from 2022 to 2034 in billion USD and billion EUR
Graph 4: Global revenues from 2022 to 2034 in billion USD – split by region
Graph 5: Global revenues from 2022 to 2034 in billion EUR – split by region
Graph 6: Global production from 2022 to 2034
Graph 7: Global production from 2022 to 2034 – split by region
Graph 8: Global demand from 2022 to 2034 – split by application
Graph 9: Global demand in the “paper and packaging” segment from 2022 to 2034 – split by region
Graph 10: Global demand in the “construction” segment from 2022 to 2034 – split by region
Graph 11: Global demand in the “wood processing” segment from 2022 to 2034 – split by region
Graph 12: Global demand in the “transportation” segment from 2022 to 2034 – split by region
Graph 13: Global demand in the “shoes, textiles, and leather” segment from 2022 to 2034 – split by region
Graph 14: Global demand in the “consumer goods” segment from 2022 to 2034 – split by region
Graph 15: Global demand in “other applications” from 2022 to 2034 – split by region
Graph 16: Global demand from 2022 to 2034 – split by product
Graph 17: Global demand for “vinyl adhesives” from 2022 to 2034 – split by region
Graph 18: Global demand for “acrylic adhesives” from 2022 to 2034 – split by region
Graph 19: Global demand for “polyurethane adhesives” from 2022 to 2034 – split by region
Graph 20: Global demand for “elastomer adhesives” from 2022 to 2034 – split by region
Graph 21: Global demand for “epoxy adhesives” from 2022 to 2034 – split by region
Graph 22: Global demand for “other products” from 2022 to 2034 – split by region
Graph 23: Demand in Western Europe from 2022 to 2034
Graph 24: Revenues generated in Western Europe from 2022 to 2034 in billion USD and billion EUR
Graph 25: Production in Western Europe from 2022 to 2034
Graph 26: Demand in Western Europe from 2022 to 2034 – split by application
Graph 27: Demand in Eastern Europe from 2022 to 2034
Graph 28: Revenues generated in Eastern Europe from 2022 to 2034, in billion USD and billion EUR
Graph 29: Production in Eastern Europe from 2022 to 2034
Graph 30: Demand in Eastern Europe from 2022 to 2034 – split by application
Graph 31: Demand in North America from 2022 to 2034
Graph 32: Revenues generated in North America from 2022 to 2034, in billion USD and billion EUR
Graph 33: Production in North America from 2022 to 2034
Graph 34: Demand in North America from 2022 to 2034 – split by application
Graph 35: Demand in South America from 2022 to 2034
Graph 36: Revenues generated in South America from 2022 to 2034, in billion USD and billion EUR
Graph 37: Production in South America from 2022 to 2034
Graph 38: Demand in South America from 2022 to 2034 – split by application
Graph 39: Demand in Asia-Pacific from 2022 to 2034
Graph 40: Revenues generated in Asia-Pacific from 2022 to 2034, in billion USD and billion EUR
Graph 41: Production in Asia-Pacific from 2022 to 2034
Graph 42: Demand in Asia-Pacific from 2022 to 2034 – split by application
Graph 43: Demand in the Middle East from 2022 to 2034
Graph 44: Revenues generated in the Middle East from 2022 to 2034, in billion USD and billion EUR
Graph 45: Production in the Middle East from 2022 to 2034
Graph 46: Demand in the Middle East from 2022 to 2034 – split by application
Graph 47: Demand in Africa from 2022 to 2034
Graph 48: Revenues generated in Africa from 2022 to 2034, in billion USD and billion EUR
Graph 49: Production in Africa from 2022 to 2034
Graph 50: Demand in Africa from 2022 to 2034 – split by application
Graph 51: Demand in France from 2022 to 2034
Graph 52: Production in France from 2022 to 2034
Graph 53: Demand in Germany from 2022 to 2034
Graph 54: Production in Germany from 2022 to 2034
Graph 55: Demand in Italy from 2022 to 2034
Graph 56: Production in Italy from 2022 to 2034
Graph 57: Demand in Spain from 2022 to 2034
Graph 58: Production in Spain from 2022 to 2034
Graph 59: Demand in the United Kingdom from 2022 to 2034
Graph 60: Production in the United Kingdom from 2022 to 2034
Graph 61: Demand in Other Western Europe from 2022 to 2034
Graph 62: Production in Other Western Europe from 2022 to 2034
Graph 63: Demand in Poland from 2022 to 2034
Graph 64: Production in Poland from 2022 to 2034
Graph 65: Demand in Russia from 2022 to 2034
Graph 66: Production in Russia from 2022 to 2034
Graph 67: Demand in Türkiye from 2022 to 2034
Graph 68: Production in Türkiye from 2022 to 2034
Graph 69: Demand in Other Eastern Europe from 2022 to 2034
Graph 70: Production in Other Eastern Europe from 2022 to 2034
Graph 71: Demand in Canada from 2022 to 2034
Graph 72: Production in Canada from 2022 to 2034
Graph 73: Demand in Mexico from 2022 to 2034
Graph 74: Production in Mexico from 2022 to 2034
Graph 75: Demand in the USA from 2022 to 2034
Graph 76: Production in the USA from 2022 to 2034
Graph 77: Demand in Brazil from 2022 to 2034
Graph 78: Production in Brazil from 2022 to 2034
Graph 79: Demand in Other South America from 2022 to 2034
Graph 80: Production in Other South America from 2022 to 2034
Graph 81: Demand in China from 2022 to 2034
Graph 82: Production in China from 2022 to 2034
Graph 83: Demand in India from 2022 to 2034
Graph 84: Production in India from 2022 to 2034
Graph 85: Demand in Japan from 2022 to 2034
Graph 86: Production in Japan from 2022 to 2034
Graph 87: Demand in South Korea from 2022 to 2034
Graph 88: Production in South Korea from 2022 to 2034
Graph 89: Demand in Taiwan from 2022 to 2034
Graph 90: Production in Taiwan from 2022 to 2034
Graph 91: Demand in Other Asia-Pacific from 2022 to 2034
Graph 92: Production in Other Asia-Pacific from 2022 to 2034
Table 1: Global demand from 2022 to 2034 – split by region
Table 2: Global revenues from 2022 to 2034 in million USD – split by region
Table 3: Global revenues from 2022 to 2034 in million EUR – split by region
Table 4: Global production from 2022 to 2034 – split by region
Table 5: Global demand from 2022 to 2034 – split by application
Table 6: Global demand in the “paper and packaging” segment from 2022 to 2034 – split by region
Table 7: Global demand in the “construction” segment from 2022 to 2034 – split by region
Table 8: Global demand in the “wood processing” segment from 2022 to 2034 – split by region
Table 9: Global demand in the “transportation” segment from 2022 to 2034 – split by region
Table 10: Global demand in the “shoes, textiles, and leather” segment from 2022 to 2034 – split by region
Table 11: Global demand in the “consumer goods” segment from 2022 to 2034 – split by region
Table 12: Global demand in “other applications” from 2022 to 2034 – split by region
Table 13: Global revenues from 2022 to 2034 – split by application
Table 14: Global revenues generated in the “paper and packaging” segment from 2022 to 2034 – split by region
Table 15: Global revenues generated in the “construction” segment from 2022 to 2034 – split by region
Table 16: Global revenues generated in the “wood processing” segment from 2022 to 2034 – split by region
Table 17: Global revenues generated in the “transportation” segment from 2022 to 2034 – split by region
Table 18: Global revenues generated in the “shoes, textiles, and leather” segment from 2022 to 2034 – split by region
Table 19: Global revenues generated in the “consumer goods” segment from 2022 to 2034 – split by region
Table 20: Global revenues generated in “other applications” from 2022 to 2034 – split by region
Table 21: Global demand from 2022 to 2034 – split by product
Table 22: Global demand for “vinyl adhesives” from 2022 to 2034 – split by region
Table 23: Global demand for “acrylic adhesives” from 2022 to 2034 – split by region
Table 24: Global demand for “polyurethane adhesives” from 2022 to 2034 – split by region
Table 25: Global demand for “elastomer adhesives” from 2022 to 2034 – split by region
Table 26: Global demand for “epoxy adhesives” from 2022 to 2034 – split by region
Table 27: Global demand for “other products” from 2022 to 2034 – split by region
Table 28: Global demand from 2022 to 2034 – split by technology
Table 29: Global demand for “water-based adhesives” from 2022 to 2034 – split by region
Table 30: Global demand for “hot-melt adhesives” from 2022 to 2034 – split by region
Table 31: Global demand for “solvent-based adhesives” from 2022 to 2034 – split by region
Table 32: Global demand for “reactive adhesives” from 2022 to 2034 – split by region
Table 33: Global demand for “other adhesive technologies” from 2022 to 2034 – split by region
Table 34: Worldwide production from 2022 to 2034 – split by product
Table 35: Global production of “vinyl adhesives” from 2022 to 2034 – split by region
Table 36: Global production of “acrylic adhesives” from 2022 to 2034 – split by region
Table 37: Global production of “polyurethane adhesives” from 2022 to 2034 – split by region
Table 38: Global production of “elastomer adhesives” from 2022 to 2034 – split by region
Table 39: Global production of “epoxy adhesives” from 2022 to 2034 – split by region
Table 40: Global production of “other products” from 2022 to 2034 – split by region
Table 41: Demand in Western Europe from 2022 to 2034 – split by major countries
Table 42: Revenues generated in Western Europe from 2022 to 2034, in million USD and million EUR
Table 43: Revenues generated in Western Europe from 2022 to 2034 – split by application
Table 44: Production in Western Europe from 2022 to 2034 – split by major countries
Table 45: Production in Western Europe from 2022 to 2034 – split by product
Table 46: Demand in Western Europe from 2022 to 2034 – split by application
Table 47: Demand in Western Europe from 2022 to 2034 – split by product
Table 48: Demand in Western Europe from 2022 to 2034 – split by technology
Table 49: Demand in Eastern Europe from 2022 to 2034 – split by major countries
Table 50: Revenues generated in Eastern Europe from 2022 to 2034, in million USD and million EUR
Table 51: Revenues generated in Eastern Europe from 2022 to 2034 – split by application
Table 52: Production in Eastern Europe from 2022 to 2034 – split by major countries
Table 53: Production in Eastern Europe from 2022 to 2034 – split by product
Table 54: Demand in Eastern Europe from 2022 to 2034 – split by application
Table 55: Demand in Eastern Europe from 2022 to 2034 – split by product
Table 56: Demand in Eastern Europe from 2022 to 2034 – split by technology
Table 57: Demand in North America from 2022 to 2034 – split by major countries
Table 58: Revenues generated in North America from 2022 to 2034, in million USD and million EUR
Table 59: Revenues generated in North America from 2022 to 2034 – split by application
Table 60: Production in North America from 2022 to 2034 – split by major countries
Table 61: Production in North America from 2022 to 2034 – split by product
Table 62: Demand in North America from 2022 to 2034 – split by application
Table 63: Demand in North America from 2022 to 2034 – split by product
Table 64: Demand in North America from 2022 to 2034 – split by technology
Table 65: Demand in South America from 2022 to 2034 – split by major countries
Table 66: Revenues generated in South America from 2022 to 2034, in million USD and million EUR
Table 67: Revenues generated in South America from 2022 to 2034 – split by application
Table 68: Production in South America from 2022 to 2034 – split by major countries
Table 69: Production in South America from 2022 to 2034 – split by product
Table 70: Demand in South America from 2022 to 2034 – split by application
Table 71: Demand in South America from 2022 to 2034 – split by product
Table 72: Demand in South America from 2022 to 2034 – split by technology
Table 73: Demand in Asia-Pacific from 2022 to 2034 – split by major countries
Table 74: Revenues generated in Asia-Pacific from 2022 to 2034, in million USD and million EUR
Table 75: Revenues generated in Asia-Pacific from 2022 to 2034 – split by application
Table 76: Production in Asia-Pacific from 2022 to 2034 – split by major countries
Table 77: Production in Asia-Pacific from 2022 to 2034 – split by product
Table 78: Demand in Asia-Pacific from 2022 to 2034 – split by application
Table 79: Demand in Asia-Pacific from 2022 to 2034 – split by product
Table 80: Demand in Asia-Pacific from 2022 to 2034 – split by technology
Table 81: Revenues generated in the Middle East from 2022 to 2034, in million USD and million EUR
Table 82: Revenues generated in the Middle East from 2022 to 2034 – split by application
Table 83: Production in the Middle East from 2022 to 2034 – split by product
Table 84: Demand in the Middle East from 2022 to 2034 – split by application
Table 85: Demand in the Middle East from 2022 to 2034 – split by product
Table 86: Demand in the Middle East from 2022 to 2034 – split by technology
Table 87: Revenues generated in Africa from 2022 to 2034, in million USD and million EUR
Table 88: Revenues generated in Africa from 2022 to 2034 – split by application
Table 89: Production in Africa from 2022 to 2034 – split by product
Table 90: Demand in Africa from 2022 to 2034 – split by application
Table 91: Demand in Africa from 2022 to 2034 – split by product
Table 92: Demand in Africa from 2022 to 2034 – split by technology
Table 93: Revenues generated in France from 2022 to 2034, in million USD and million EUR
Table 94: Revenues generated in France from 2022 to 2034 – split by application
Table 95: Demand in France from 2022 to 2034 – split by application
Table 96: Demand in France from 2022 to 2034 – split by product
Table 97: Demand in France from 2022 to 2034 – split by technology
Table 98: Production, import, export, and demand in France from 2022 to 2034
Table 99: Production in France from 2022 to 2034 – split by product
Table 100: Revenues generated in Germany from 2022 to 2034, in million USD and million EUR
Table 101: Revenues generated in Germany from 2022 to 2034 – split by application
Table 102: Demand in Germany from 2022 to 2034 – split by application
Table 103: Demand in Germany from 2022 to 2034 – split by product
Table 104: Demand in Germany from 2022 to 2034 – split by technology
Table 105: Production, import, export, and demand in Germany from 2022 to 2034
Table 106: Production in Germany from 2022 to 2034 – split by product
Table 107: Revenues generated in Italy from 2022 to 2034, in million USD and million EUR
Table 108: Revenues generated in Italy from 2022 to 2034 – split by application
Table 109: Demand in Italy from 2022 to 2034 – split by application
Table 110: Demand in Italy from 2022 to 2034 – split by product
Table 111: Demand in Italy from 2022 to 2034 – split by technology
Table 112: Production, import, export, and demand in Italy from 2022 to 2034
Table 113: Production in Italy from 2022 to 2034 – split by product
Table 114: Revenues generated in Spain from 2022 to 2034, in million USD and million EUR
Table 115: Revenues generated in Spain from 2022 to 2034 – split by application
Table 116: Demand in Spain from 2022 to 2034 – split by application
Table 117: Demand in Spain from 2022 to 2034 – split by product
Table 118: Demand in Spain from 2022 to 2034 – split by technology
Table 119: Production, import, export, and demand in Spain from 2022 to 2034
Table 120: Production in Spain from 2022 to 2034 – split by product
Table 121: Revenues generated in the United Kingdom from 2022 to 2034, in million USD and million EUR
Table 122: Revenues generated in the United Kingdom from 2022 to 2034 – split by application
Table 123: Demand in the United Kingdom from 2022 to 2034 – split by application
Table 124: Demand in the United Kingdom from 2022 to 2034 – split by product
Table 125: Demand in the United Kingdom from 2022 to 2034 – split by technology
Table 126: Production, import, export, and demand in the United Kingdom from 2022 to 2034
Table 127: Production in the United Kingdom from 2022 to 2034 – split by product
Table 128: Revenues generated in Other Western Europe from 2022 to 2034, in million USD and million EUR
Table 129: Revenues generated in Other Western Europe from 2022 to 2034 – split by application
Table 130: Demand in Other Western Europe from 2022 to 2034 – split by application
Table 131: Demand in Other Western Europe from 2022 to 2034 – split by product
Table 132: Demand in Other Western Europe from 2022 to 2034 – split by technology
Table 133: Production, import, export, and demand in Other Western Europe from 2022 to 2034
Table 134: Production in Other Western Europe from 2022 to 2034 – split by product
Table 135: Revenues generated in Poland from 2022 to 2034, in million USD and million EUR
Table 136: Revenues generated in Poland from 2022 to 2034 – split by application
Table 137: Demand in Poland from 2022 to 2034 – split by application
Table 138: Demand in Poland from 2022 to 2034 – split by product
Table 139: Demand in Poland from 2022 to 2034 – split by technology
Table 140: Production, import, export, and demand in Poland from 2022 to 2034
Table 141: Production in Poland from 2022 to 2034 – split by product
Table 142: Revenues generated in Russia from 2022 to 2034, in million USD and million EUR
Table 143: Revenues generated in Russia from 2022 to 2034 – split by application
Table 144: Demand in Russia from 2022 to 2034 – split by application
Table 145: Demand in Russia from 2022 to 2034 – split by product
Table 146: Demand in Russia from 2022 to 2034 – split by technology
Table 147: Production, import, export, and demand in Russia from 2022 to 2034
Table 148: Production in Russia from 2022 to 2034 – split by product
Table 149: Revenues generated in Türkiye from 2022 to 2034, in million USD and million EUR
Table 150: Revenues generated in Türkiye from 2022 to 2034 – split by application
Table 151: Demand in Türkiye from 2022 to 2034 – split by application
Table 152: Demand in Türkiye from 2022 to 2034 – split by product
Table 153: Demand in Türkiye from 2022 to 2034 – split by technology
Table 154: Production, import, export, and demand in Türkiye from 2022 to 2034
Table 155: Production in Türkiye from 2022 to 2034 – split by product
Table 156: Revenues generated in Other Eastern Europe from 2022 to 2034, in million USD and million EUR
Table 157: Revenues generated in Other Eastern Europe from 2022 to 2034 – split by application
Table 158: Demand in Other Eastern Europe from 2022 to 2034 – split by application
Table 159: Demand in Other Eastern Europe from 2022 to 2034 – split by product
Table 160: Demand in Other Eastern Europe from 2022 to 2034 – split by technology
Table 161: Production, import, export, and demand in Other Eastern Europe from 2022 to 2034
Table 162: Production in Other Eastern Europe from 2022 to 2034 – split by product
Table 163: Revenues generated in Canada from 2022 to 2034, in million USD and million EUR
Table 164: Revenues generated in Canada from 2022 to 2034 – split by application
Table 165: Demand in Canada from 2022 to 2034 – split by application
Table 166: Demand in Canada from 2022 to 2034 – split by product
Table 167: Demand in Canada from 2022 to 2034 – split by technology
Table 168: Production, import, export, and demand in Canada from 2022 to 2034
Table 169: Production in Canada from 2022 to 2034 – split by product
Table 170: Revenues generated in Mexico from 2022 to 2034, in million USD and million EUR
Table 171: Revenues generated in Mexico from 2022 to 2034 – split by application
Table 172: Demand in Mexico from 2022 to 2034 – split by application
Table 173: Demand in Mexico from 2022 to 2034 – split by product
Table 174: Demand in Mexico from 2022 to 2034 – split by technology
Table 175: Production, import, export, and demand in Mexico from 2022 to 2034
Table 176: Production in Mexico from 2022 to 2034 – split by product
Table 177: Revenues generated in the USA from 2022 to 2034, in million USD and million EUR
Table 178: Revenues generated in the USA from 2022 to 2034 – split by application
Table 179: Demand in the USA from 2022 to 2034 – split by application
Table 180: Demand in the USA from 2022 to 2034 – split by product
Table 181: Demand in the USA from 2022 to 2034 – split by technology
Table 182: Production, import, export, and demand in the USA from 2022 to 2034
Table 183: Production in the USA from 2022 to 2034 – split by product
Table 184: Revenues generated in Brazil from 2022 to 2034, in million USD and million EUR
Table 185: Revenues generated in Brazil from 2022 to 2034 – split by application
Table 186: Demand in Brazil from 2022 to 2034 – split by application
Table 187: Demand in Brazil from 2022 to 2034 – split by product
Table 188: Demand in Brazil from 2022 to 2034 – split by technology
Table 189: Production, import, export, and demand in Brazil from 2022 to 2034
Table 190: Production in Brazil from 2022 to 2034 – split by product
Table 191: Revenues generated in Other South America from 2022 to 2034, in million USD and million EUR
Table 192: Revenues generated in Other South America from 2022 to 2034 – split by application
Table 193: Demand in Other South America from 2022 to 2034 – split by application
Table 194: Demand in Other South America from 2022 to 2034 – split by product
Table 195: Demand in Other South America from 2022 to 2034 – split by technology
Table 196: Production, import, export, and demand in Other South America from 2022 to 2034
Table 197: Production in Other South America from 2022 to 2034 – split by product
Table 198: Revenues generated in China from 2022 to 2034, in million USD and million EUR
Table 199: Revenues generated in China from 2022 to 2034 – split by application
Table 200: Demand in China from 2022 to 2034 – split by application
Table 201: Demand in China from 2022 to 2034 – split by product
Table 202: Demand in China from 2022 to 2034 – split by technology
Table 203: Production, import, export, and demand in China from 2022 to 2034
Table 204: Production in China from 2022 to 2034 – split by product
Table 205: Revenues generated in India from 2022 to 2034, in million USD and million EUR
Table 206: Revenues generated in India from 2022 to 2034 – split by application
Table 207: Demand in India from 2022 to 2034 – split by application
Table 208: Demand in India from 2022 to 2034 – split by product
Table 209: Demand in India from 2022 to 2034 – split by technology
Table 210: Production, import, export, and demand in India from 2022 to 2034
Table 211: Production in India from 2022 to 2034 – split by product
Table 212: Revenues generated in Japan from 2022 to 2034, in million USD and million EUR
Table 213: Revenues generated in Japan from 2022 to 2034 – split by application
Table 214: Demand in Japan from 2022 to 2034 – split by application
Table 215: Demand in Japan from 2022 to 2034 – split by product
Table 216: Demand in Japan from 2022 to 2034 – split by technology
Table 217: Production, import, export, and demand in Japan from 2022 to 2034
Table 218: Production in Japan from 2022 to 2034 – split by product
Table 219: Revenues generated in South Korea from 2022 to 2034, in million USD and million EUR
Table 220: Revenues generated in South Korea from 2022 to 2034 – split by application
Table 221: Demand in South Korea from 2022 to 2034 – split by application
Table 222: Demand in South Korea from 2022 to 2034 – split by product
Table 223: Demand in South Korea from 2022 to 2034 – split by technology
Table 224: Production, import, export, and demand in South Korea from 2022 to 2034
Table 225: Production in South Korea from 2022 to 2034 – split by product
Table 226: Revenues generated in Taiwan from 2022 to 2034, in million USD and million EUR
Table 227: Revenues generated in Taiwan from 2022 to 2034 – split by application
Table 228: Demand in Taiwan from 2022 to 2034 – split by application
Table 229: Demand in Taiwan from 2022 to 2034 – split by product
Table 230: Demand in Taiwan from 2022 to 2034 – split by technology
Table 231: Production, import, export, and demand in Taiwan from 2022 to 2034
Table 232: Production in Taiwan from 2022 to 2034 – split by product
Table 233: Revenues generated in Other Asia-Pacific from 2022 to 2034, in million USD and million EUR
Table 234: Revenues generated in Other Asia-Pacific from 2022 to 2034 – split by application
Table 235: Demand in Other Asia-Pacific from 2022 to 2034 – split by application
Table 236: Demand in Other Asia-Pacific from 2022 to 2034 – split by product
Table 237: Demand in Other Asia-Pacific from 2022 to 2034 – split by technology
Table 238: Production, import, export, and demand in Other Asia-Pacific from 2022 to 2034
Table 239: Production in Other Asia-Pacific from 2022 to 2034 – split by product


